How to make a Pie chart in Powerpoint


With just few simple steps Piecharts can be prepared in Microsoft Powerpoint, here is a quick guide along with images on how to add piecharts to your presentation slides…
Creating a pie chart in PowerPoint is a helpful way to visually represent data and percentages. Here's how you can make a pie chart in PowerPoint:
Step 1: Open PowerPoint: Launch Microsoft PowerPoint and open the presentation where you want to insert the pie chart.
Step 2: Insert a Slide: Add a new slide where you want the pie chart to appear. You can do this by clicking the "New Slide" button on the top toolbar.

Step 3: Insert Chart: Click on the "Insert" tab at the top of the PowerPoint window.
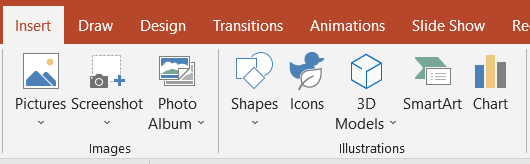
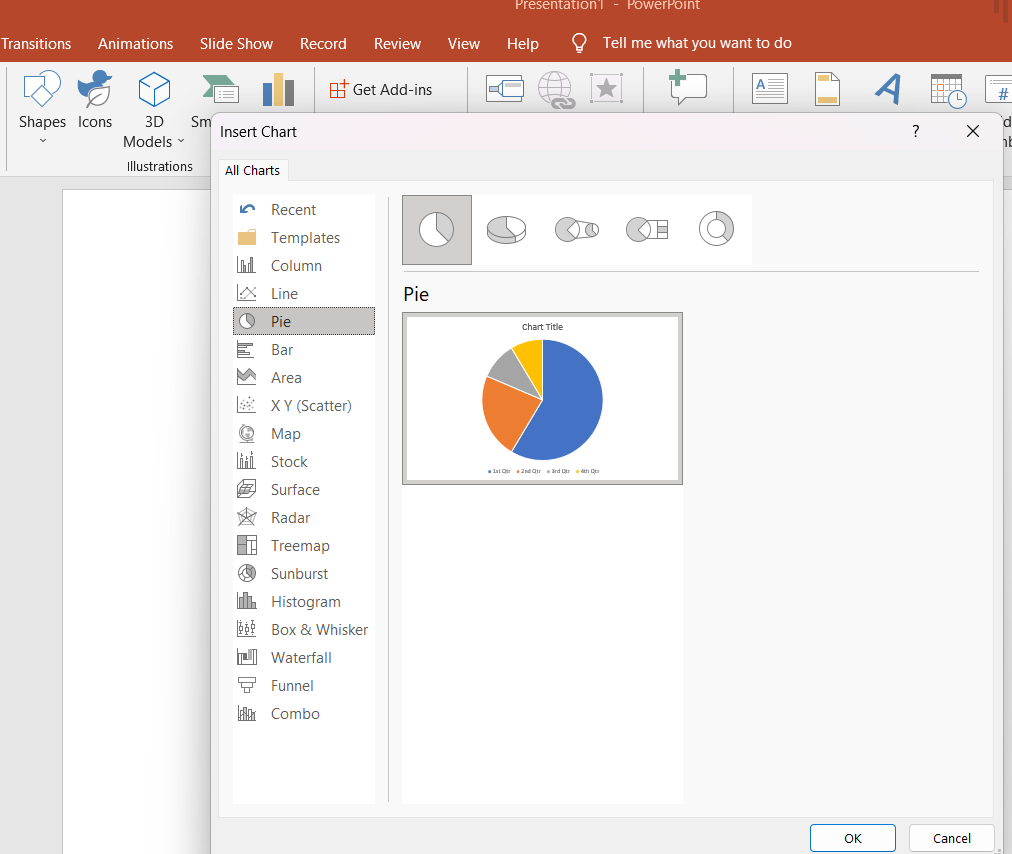
Step 4: Chart: In the "Illustrations" group, click on the "Chart" button. This will open the "Insert Chart" dialog box.
Step 5: Choose Chart Type: In the "Insert Chart" dialog, select "Pie" from the list of chart types on the left.
Step 6: Data Range: A sample data sheet will appear on the right side of the window. Replace this sample data with your actual data. You can either type your data directly or paste it from an external source, such as an Excel spreadsheet.
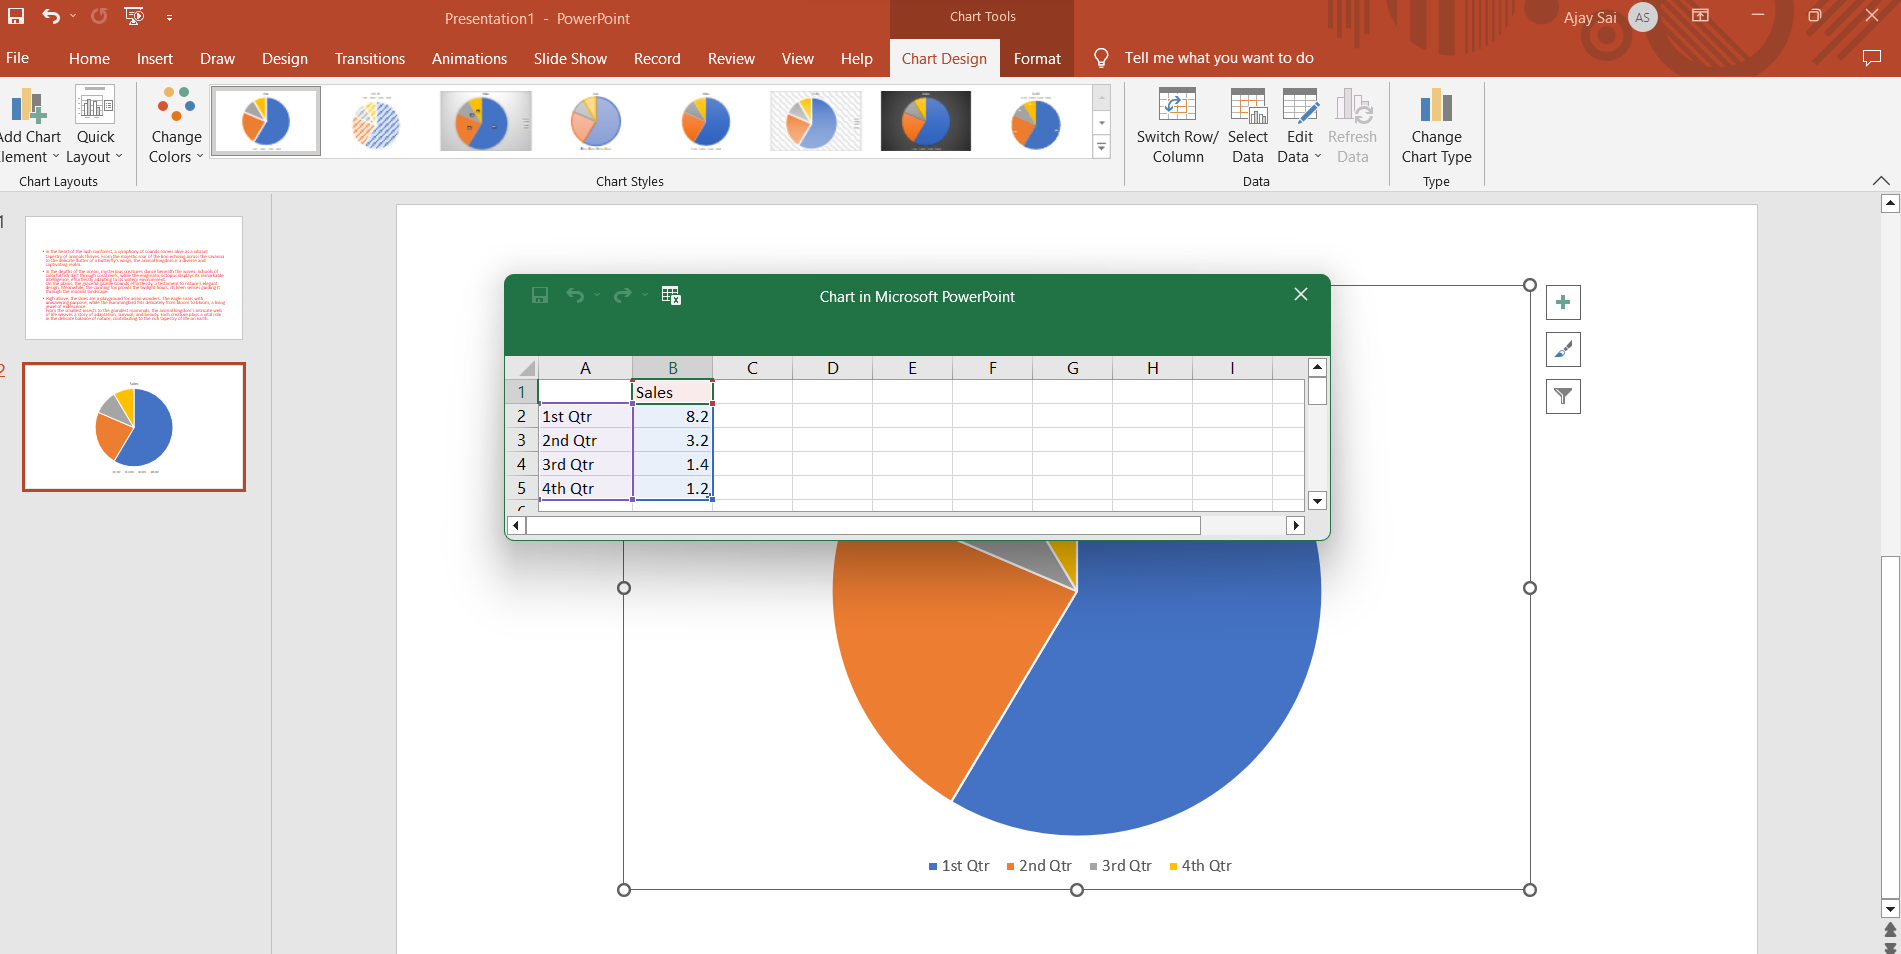
Step 7: Label Data: In the data sheet, you can label your data categories in the leftmost column and input the corresponding values in the adjacent column.

Step 8: Save: Don't forget to save your presentation after creating and formatting the pie chart.
Remember to use clear labels, appropriate colors, and meaningful data to effectively convey your information through the pie chart.
Keep evolving, keep shining—like AI technology


