How to make a gantt chart in PowerPoint


Creating a Gantt chart in PowerPoint helps visually track project timelines and task progress easily
A Gantt chart is a useful tool for managing project timelines, helping teams visualize tasks, deadlines, and milestones.
While PowerPoint doesn’t offer a built-in Gantt chart template, creating one is simple by using shapes, tables, or SmartArt.
In this guide, I’ll walk you through how to manually create a Gantt chart in PowerPoint step by step to help you track your project progress effectively.
How to Make a Gantt Chart in PowerPoint: A Step-by-Step Guide
Step 1: Open a New PowerPoint Slide
Start by opening PowerPoint and creating a new slide where you want to add your Gantt chart.
Choose a blank slide layout for more flexibility in placing the chart.
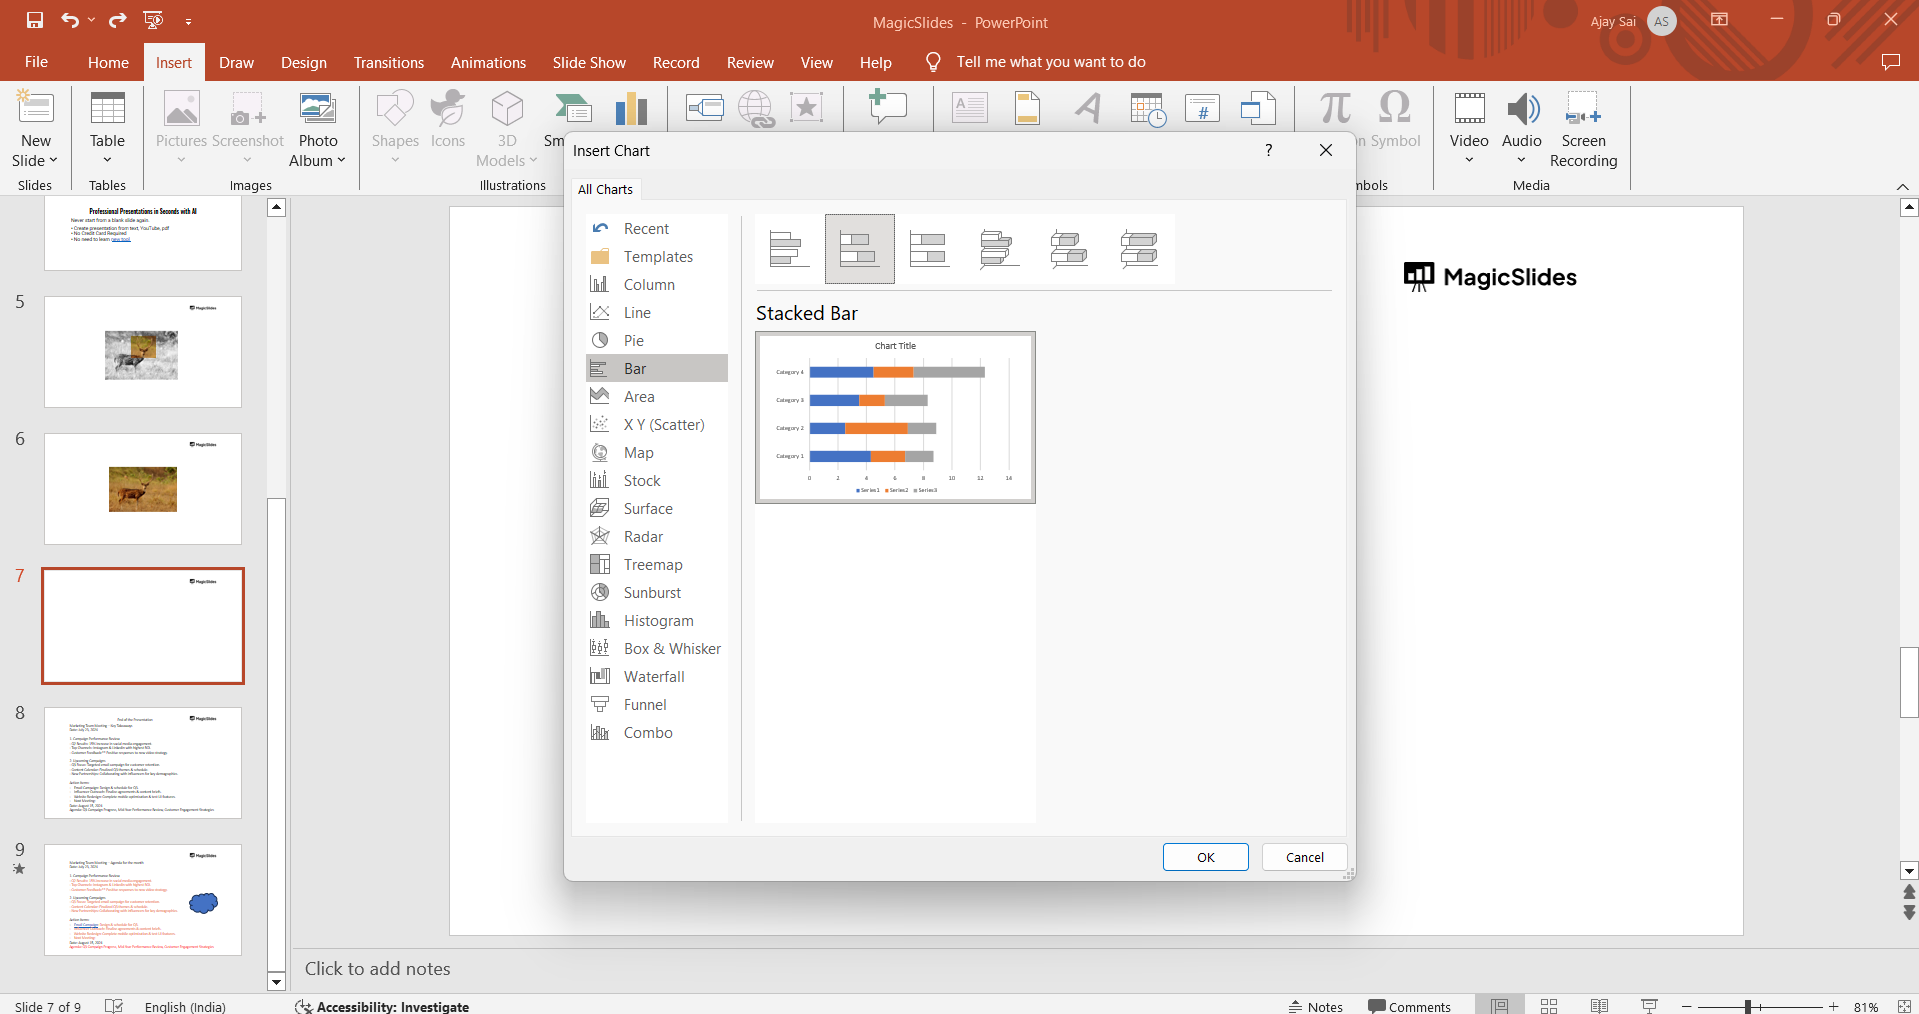
Step 2: Insert a Table for Task Organization
Go to the "Insert" tab and select "Table." Choose a table with enough columns and rows to organize your project tasks and timelines.
For example, you may need one column for tasks, one for start dates, one for end dates, and the remaining columns for time intervals (weeks or months).
Step 3: Label Your Table
In the first column, list all the tasks associated with your project, one per row. In the top row, label the timeline, such as weeks or months, depending on your project’s duration.
This creates the foundation of your Gantt chart.
Step 4: Add Task Bars and data
Click and drag on the slide to draw a bar across the corresponding timeline for each task.
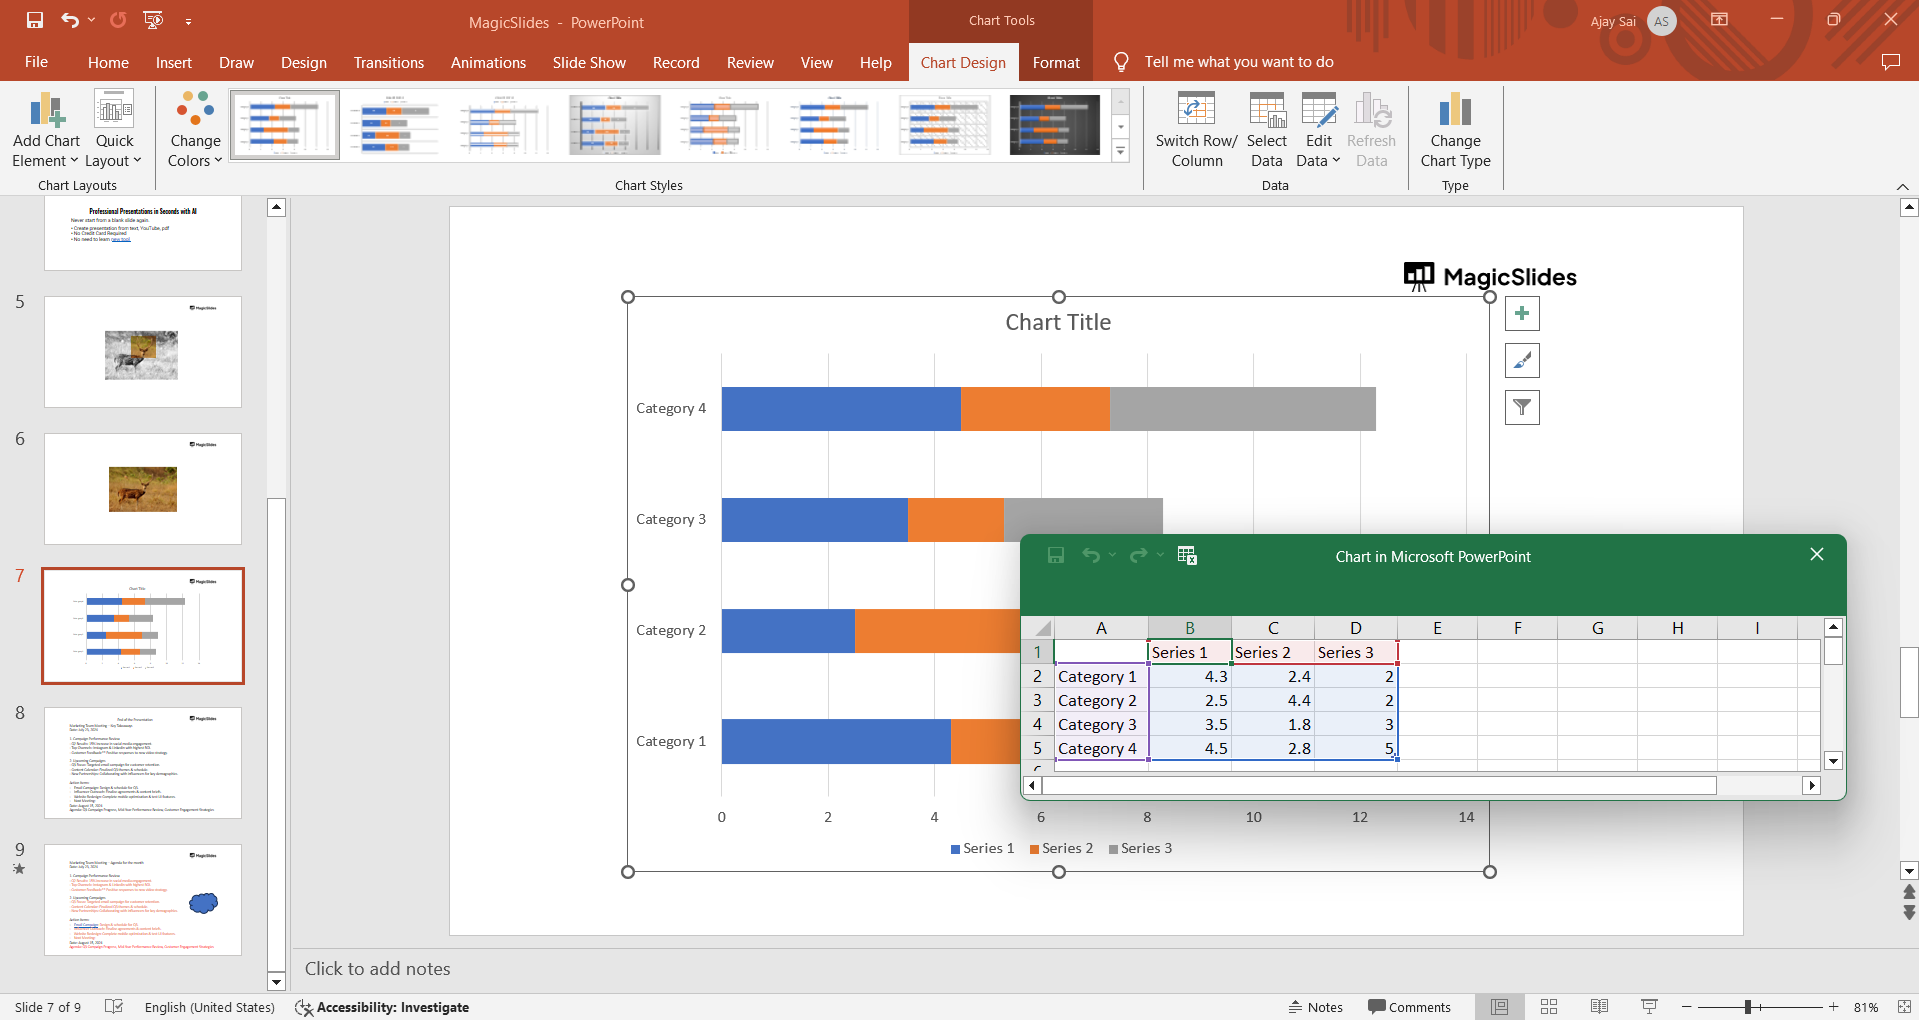
Make sure the bars start and end in line with the respective dates or time periods for the task.
Step 5: Review and Adjust
Before finishing, review your Gantt chart to make sure all tasks are clearly displayed and the timeline is accurate.
Adjust the size of shapes or text as needed to ensure everything fits well on the slide.
Conclusion
Creating a Gantt chart in PowerPoint is an excellent way to visually manage project tasks and deadlines.
Though it requires manual setup, the process is straightforward and allows you to fully customize the chart to fit your specific project needs.
With a well-constructed Gantt chart, you can clearly communicate progress and timelines to stakeholders or team members, enhancing project management and collaboration.
FAQs can come handy!
Can I create a Gantt chart using SmartArt in PowerPoint?
Yes, you can use SmartArt to create a simplified Gantt chart by selecting options like “Process” under the SmartArt Graphics.
Can I update my Gantt chart if the project timeline changes?
Absolutely! You can easily adjust the task bars by dragging or resizing the shapes to reflect new deadlines or task durations.
Is there a Gantt chart template available in PowerPoint?
PowerPoint doesn’t have a built-in Gantt chart template, but you can find free Gantt chart templates online or manually create one using the steps above.


