Why is Text added to a Data Visualization Presentation?


Text in data visualizations enhances understanding, providing context and clarity to key insights.
Text is added to a data visualization presentation to provide context, explanations, and insights that help the audience understand the significance of the visualized data.
While charts, graphs, and other visual elements can effectively communicate trends and patterns, text ensures that the key messages are clearly conveyed.
It can highlight important data points, offer interpretations, and guide the audience through the narrative of the presentation.
In essence, text complements visuals by providing clarity and enhancing the overall comprehension of the data being presented.
How to Add Text to a Data Visualization Presentation in PowerPoint
Step 1: Open Your Presentation
Start by opening your PowerPoint presentation where you have the data visualization.
You can do this by launching PowerPoint, clicking on "File" in the top-left corner, selecting "Open," and choosing the presentation you want to edit.
Step 2: Select the Slide with Data Visualization
Navigate to the slide that contains the data visualization you want to add text to.
You can do this by clicking on the slide thumbnail on the left-hand side of the PowerPoint window.
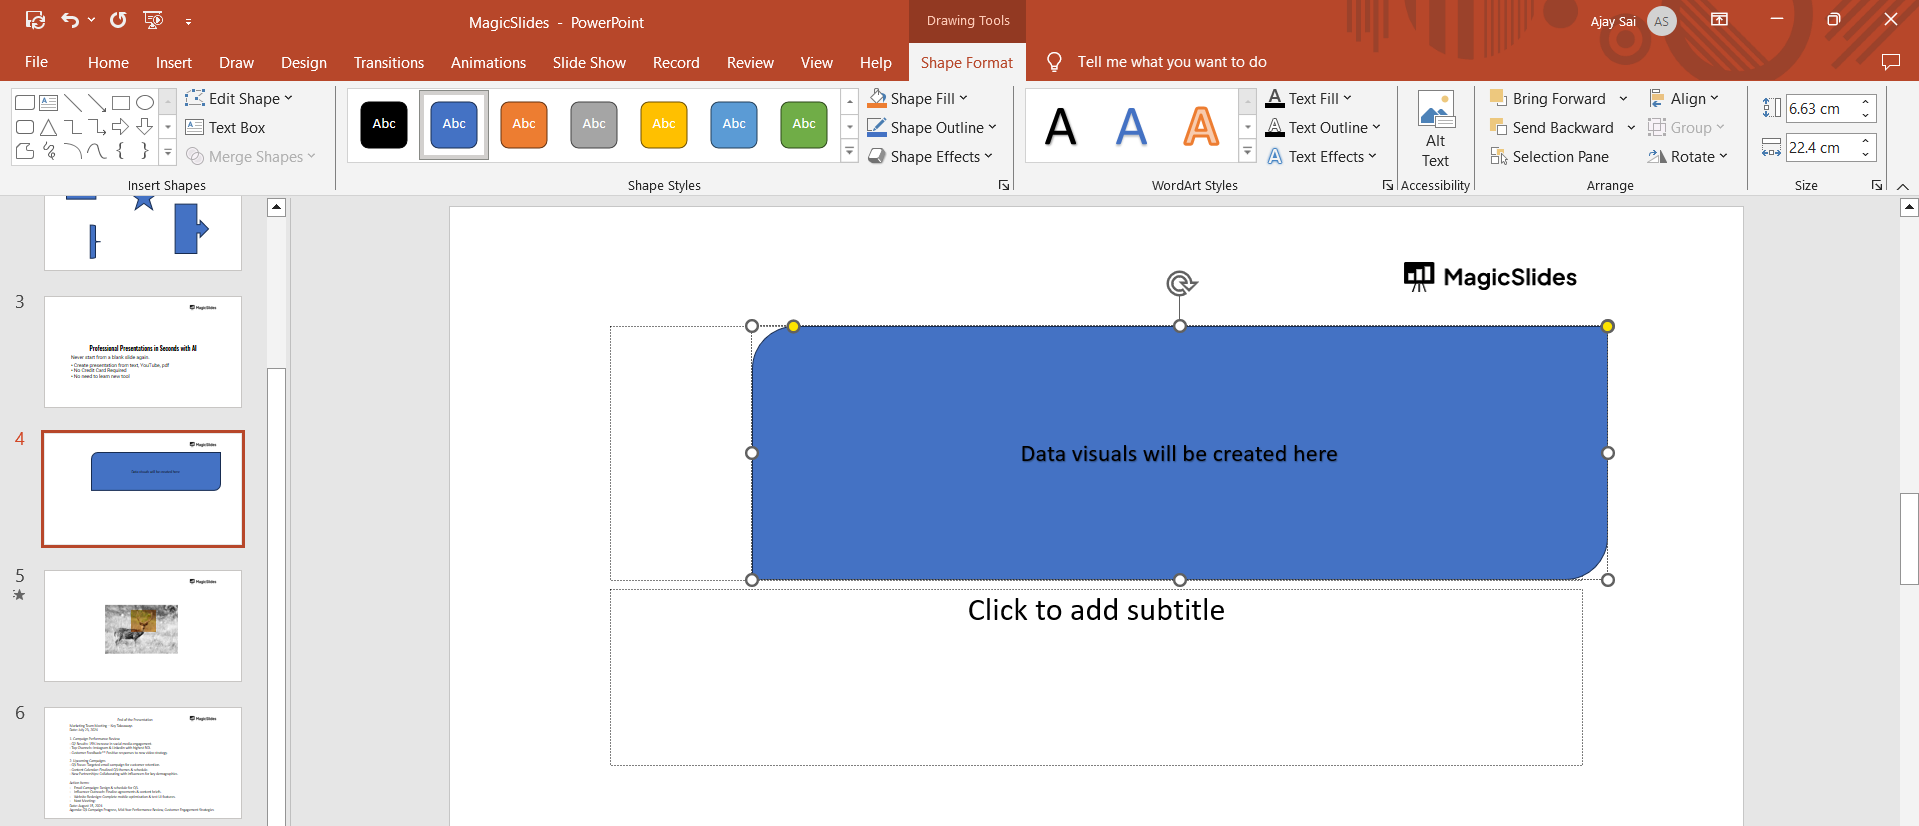
Step 3: Insert a Text Box
To add text, go to the "Insert" tab on the PowerPoint ribbon at the top of the screen. Click on "Text Box" from the dropdown menu.
Your cursor will change to a crosshair, allowing you to click anywhere on the slide to place the text box.
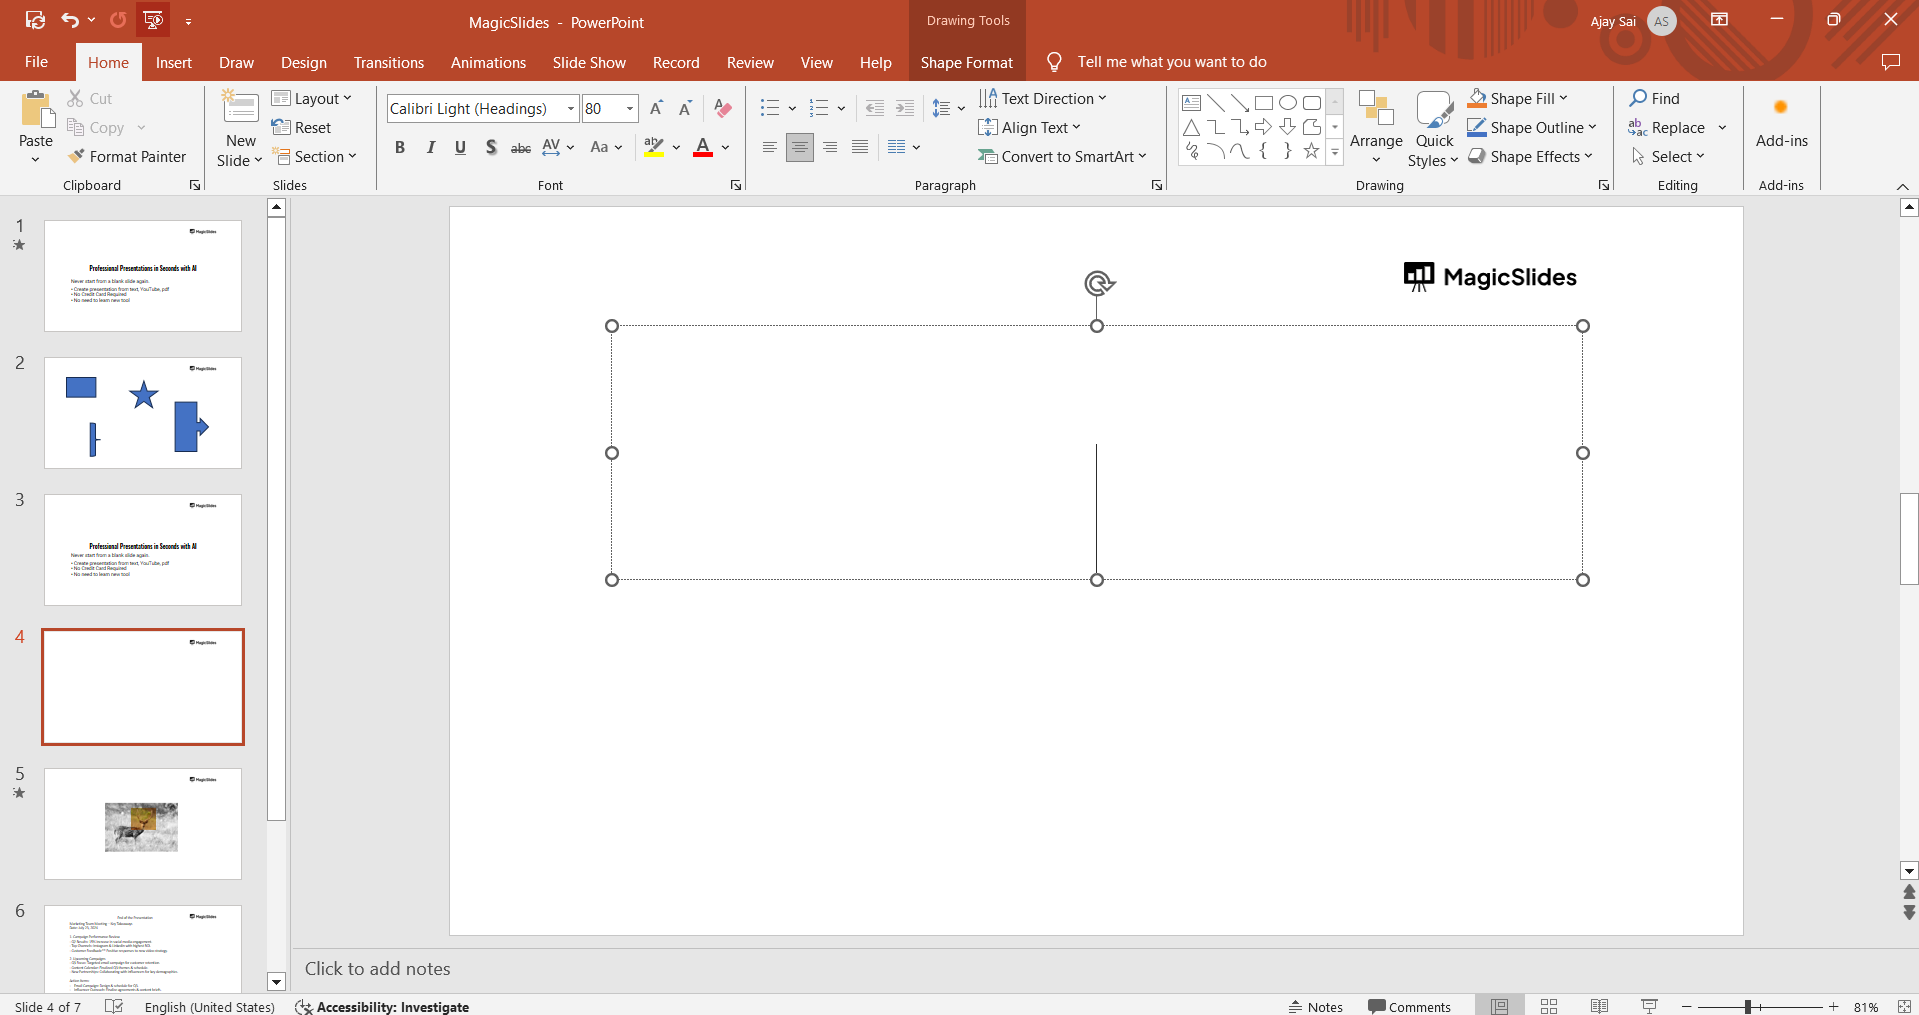
Click and drag to create a text box where you want the text to appear.
Step 4: Add Your Text
Click inside the text box and start typing the text you want to add.
This could include titles, labels, explanations, or any other relevant information that enhances the understanding of your data visualization.
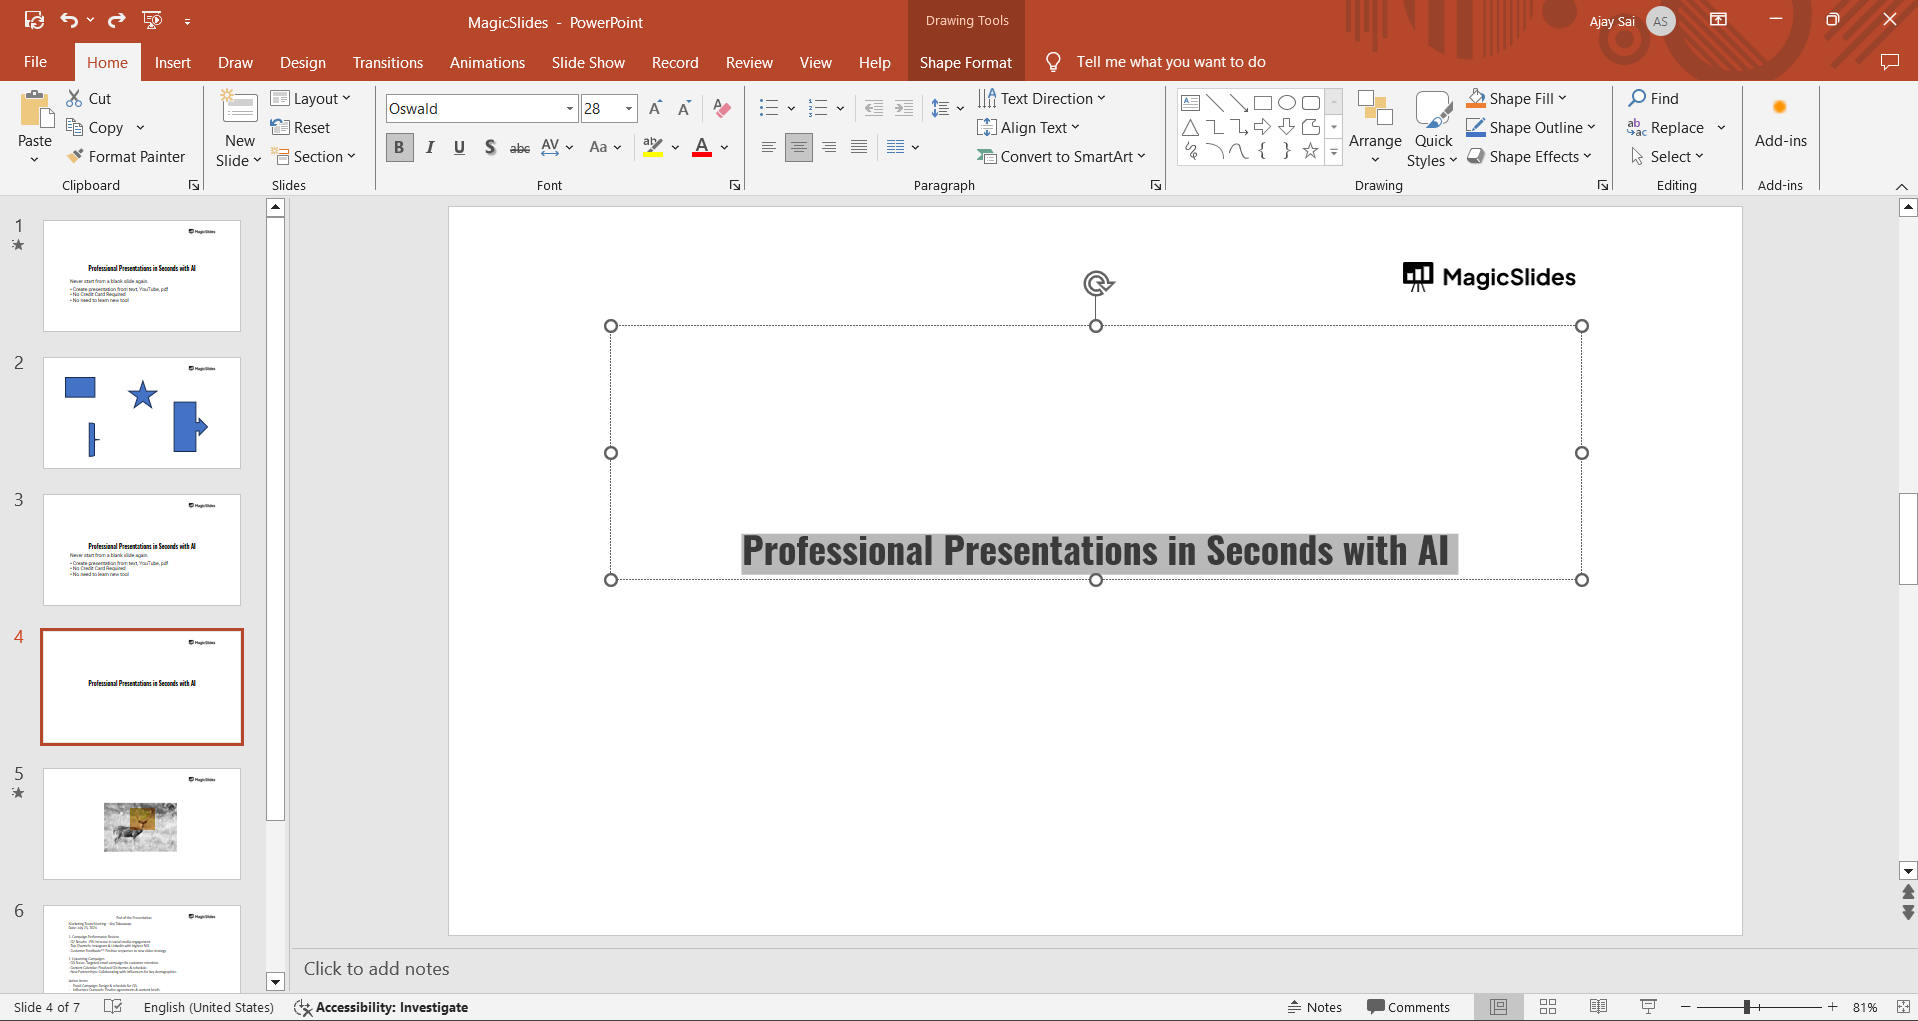
Make sure the text is clear and concise.
Step 5: Format the Text
After entering the text, you can format it to match the style of your presentation.
Highlight the text and use the formatting options in the "Home" tab to change the font, size, color, and alignment.
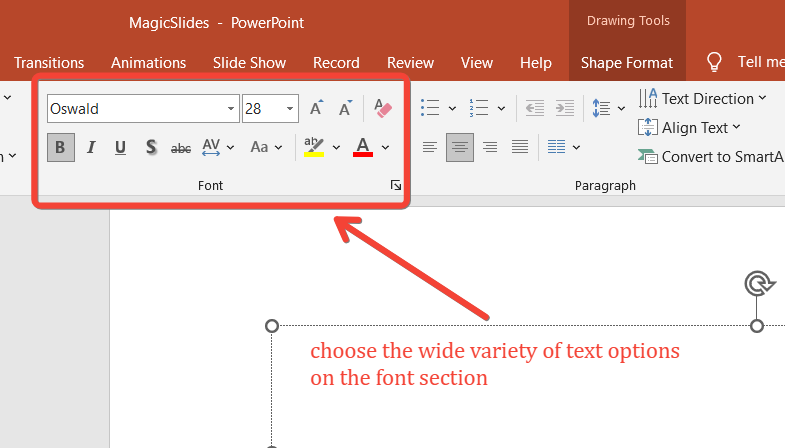
You can also use the "Bold," "Italic," or "Underline" options to emphasize certain words or phrases.
Step 6: Position the Text
Once you’ve formatted the text, you may need to reposition it on the slide. Click on the edge of the text box and drag it to the desired location.
Ensure that the text doesn’t overlap important parts of the data visualization and is placed in a way that enhances readability.
Step 7: Review and Adjust
Finally, review the slide to ensure that the text complements the data visualization without distracting from it.
Please note this is a final slide prepared with Data visual elemenst along with text dded to explain the context, you may have to prepare slide after numerous steps.
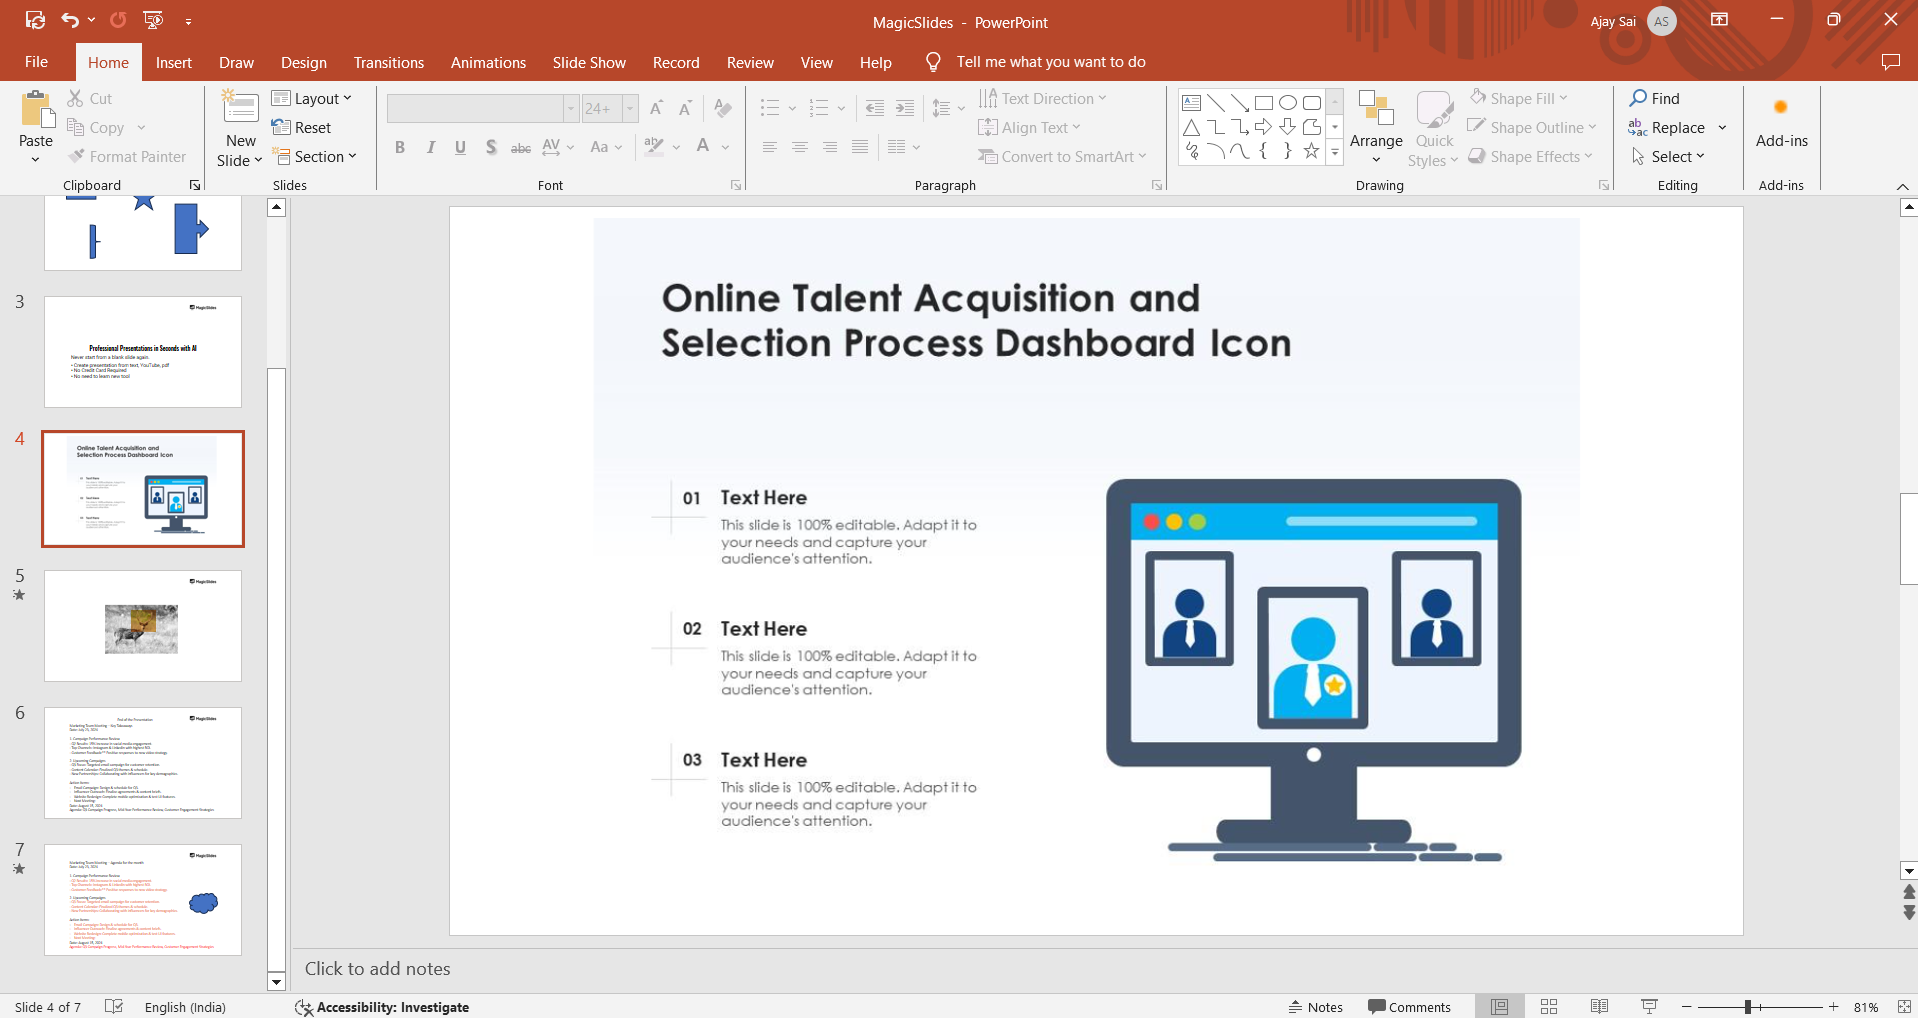
Make any necessary adjustments to the text size, position, or content to ensure it effectively communicates the intended message.
Conclusion
Adding text to a data visualization presentation is essential for providing context, guiding the audience, and emphasizing key points.
By following these steps, you can easily integrate text with your visual elements to create a more informative and engaging presentation.
Remember, the goal is to enhance the audience's understanding of the data, so ensure that your text is clear, concise, and strategically placed.
FAQs are here to help!
What type of text should I add to a data visualization?
Add titles, labels, explanations, and key insights to enhance the audience’s understanding of the visualized data.
How can I ensure text doesn’t clutter my data visualization?
Keep text concise and strategically place it where it doesn’t overlap or distract from important visual elements.
Can I use different fonts and colors for the text in my presentation?
Yes, you can format text using different fonts, colors, and styles, but maintain consistency for a professional look.


