Financial Year-End Presentations: How to Create an Effective and Engaging One


Learn how to create an effective financial year-end presentation with structured insights, data visualization, and AI tools like MagicSlides for impactful reports.
As the financial year comes to a close, businesses must present their financial results to key stakeholders, including investors, executives, employees, and board members. A financial year-end presentation is a crucial tool for summarizing business performance, highlighting achievements, addressing challenges, and setting goals for the upcoming year.
A well-structured and engaging presentation can instill confidence in stakeholders, improve transparency, and support strategic decision-making. However, crafting one that is both professional and impactful requires careful planning, clear data visualization, and the right tools.
This guide will walk you through the process of creating an effective financial year-end presentation, including essential structuring tips and how AI-powered tools like MagicSlides.app can simplify the process.
https://www.magicslides.app/public/XYZCorporationFiscalYear2023PerformanceReview_5wBzR8uH
Why Financial Year-End Presentations Are Important
A financial year-end presentation serves multiple purposes beyond just reporting numbers. It is a key communication tool that:
- Summarizes Business Performance – Provides a clear overview of revenue, profits, expenses, and financial trends.
- Engages Stakeholders – Helps investors, executives, and employees understand the company's financial health.
- Builds Transparency and Trust – Demonstrates accountability and strengthens stakeholder confidence.
- Sets Goals for the Future – Outlines strategic objectives and financial projections for the next fiscal year.
- Identifies Challenges and Solutions – Highlights financial risks and presents strategies to address them.
Given its importance, it is essential to structure the presentation effectively and use tools that enhance clarity and engagement.
Steps to Create an Effective Year-End Financial Presentation
A well-structured year-end financial presentation ensures that stakeholders understand your company’s financial performance, achievements, challenges, and future strategies. Follow these key steps to create a professional and engaging presentation.
Step 1: Define Your Objectives
Before creating your presentation, determine the purpose and audience. Ask yourself:
- Who will be attending? (Investors, board members, employees, or clients)
- What key information do they need? (Revenue, profitability, expenses, challenges, and future plans)
- What is the goal? (To inform, gain stakeholder confidence, or set future expectations)
This clarity helps in structuring content effectively.
Step 2: Gather Financial Data
Collect accurate and up-to-date financial information from balance sheets, income statements, cash flow statements, and annual reports. Key metrics to include:
- Revenue and sales performance (growth trends, major revenue sources)
- Profit and loss statement (net profit, gross margin, operating income)
- Expenses and cost management (operational costs, capital expenditures)
- Cash flow status (liquidity position, debt repayment, investment activities)
- Key financial ratios (profitability, efficiency, solvency)
Ensure the data is accurate and supported by documentation.
Step 3: Structure Your Presentation
A well-organized financial year-end presentation should be logical, concise, and visually engaging. Below is a recommended structure to follow:
1. Introduction
- Briefly introduce the purpose of the presentation.
- Provide an overview of the key topics to be covered.
- Acknowledge key stakeholders and contributors.
2. Financial Performance Summary
- Present key financial metrics, including revenue, net income, profit margins, and expenses.
- Use charts and graphs to illustrate trends over the past year.
- Highlight key drivers behind the financial performance.
3. Revenue and Sales Analysis
- Break down revenue sources by product lines, regions, or customer segments.
- Compare sales performance to previous years.
- Address any fluctuations and underlying reasons.
4. Expenses and Cost Management
- Outline major operational and capital expenses.
- Highlight cost-saving initiatives and efficiency improvements.
- Discuss any significant budget variances.
5. Profitability and Growth Metrics
- Show EBITDA (Earnings Before Interest, Taxes, Depreciation, and Amortization) and profit margins.
- Compare profitability to industry benchmarks.
- Discuss business growth, market expansion, and future revenue projections.
6. Cash Flow and Financial Stability
- Present cash flow statements to show liquidity position.
- Discuss debt, investments, and funding activities.
- Highlight strategies for maintaining financial stability.
7. Key Achievements and Milestones
- Highlight significant accomplishments, such as new product launches, market expansions, or cost-cutting measures.
- Show how these achievements have impacted financial performance.
8. Challenges and Risk Management
- Identify financial risks, market challenges, and operational issues faced during the year.
- Discuss measures taken to mitigate these risks and plans for addressing them in the future.
9. Future Financial Goals and Strategy
- Outline objectives for the next financial year.
- Provide revenue and profitability targets.
- Discuss strategic plans, investments, and growth initiatives.
10. Conclusion and Call to Action
- Summarize the key takeaways.
- Encourage stakeholder engagement by inviting questions or discussions.
- Provide next steps or actions required by the stakeholders.
How to Create a Financial Year-End Presentation Using MagicSlides.app
Manually creating a professional financial year-end presentation can be time-consuming. MagicSlides.app, an AI-powered tool, simplifies the process by automatically generating PowerPoint slides based on your topic. Here is how you can use it:
Step-by-Step Guide to Using MagicSlides.app
- Visit the Website – Go to MagicSlides.app.
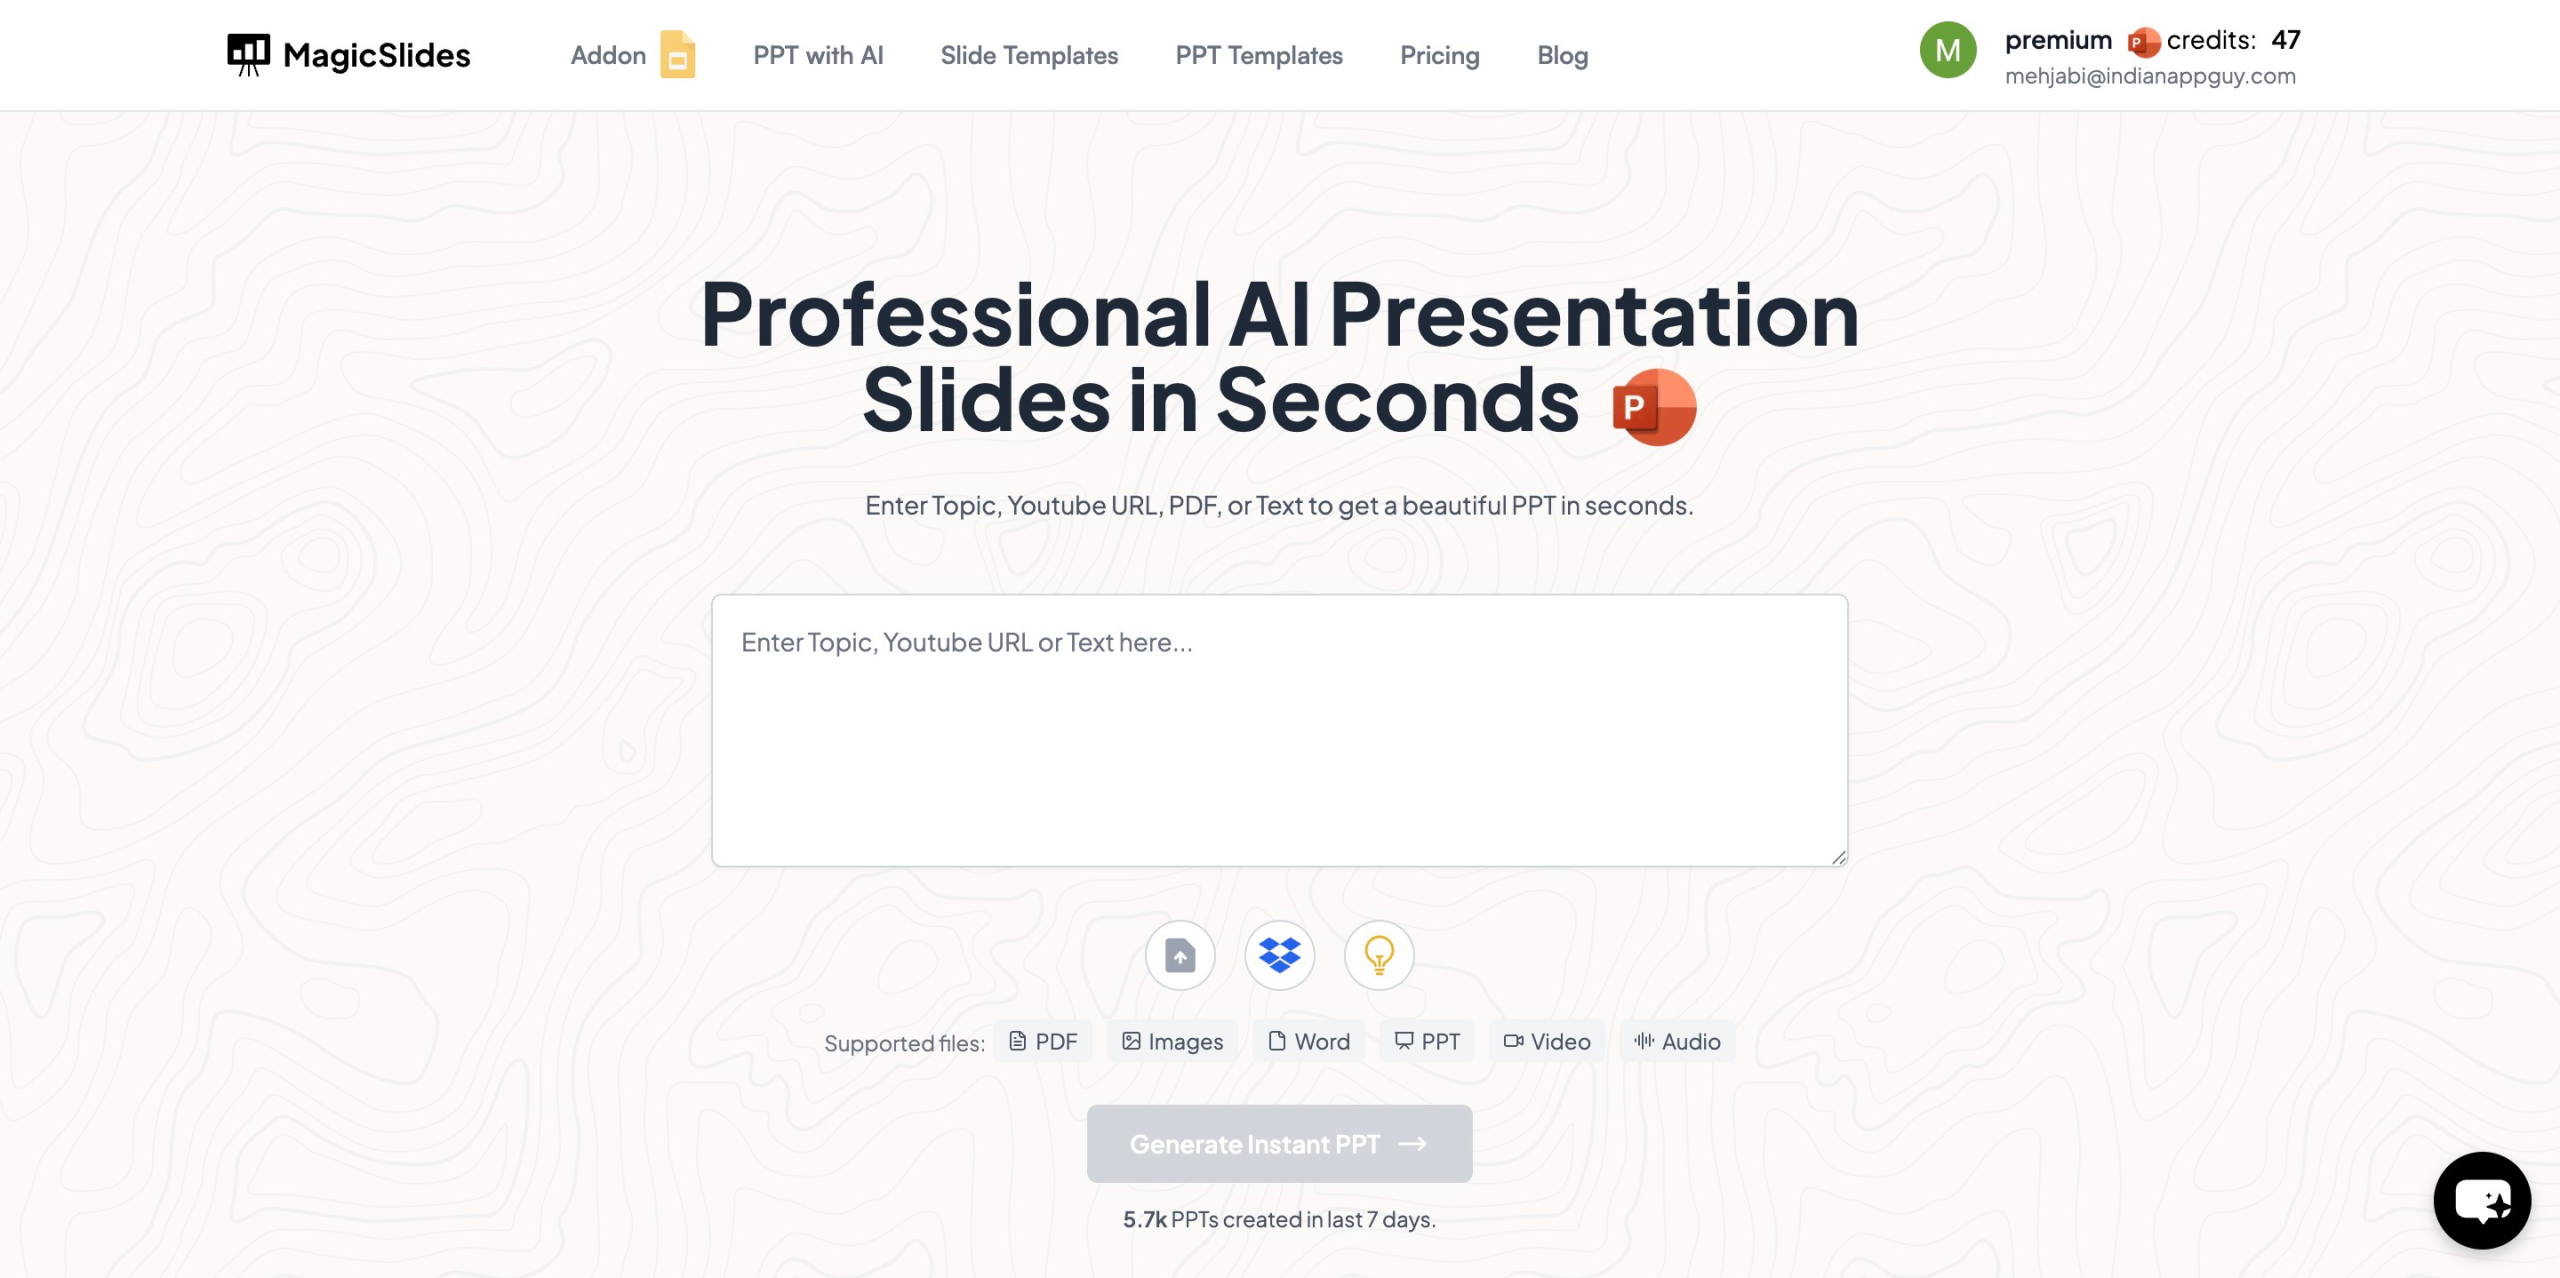
- Enter Your Topic – In the given space, type "Financial Year-End Presentation" or any specific subject you want to focus on.
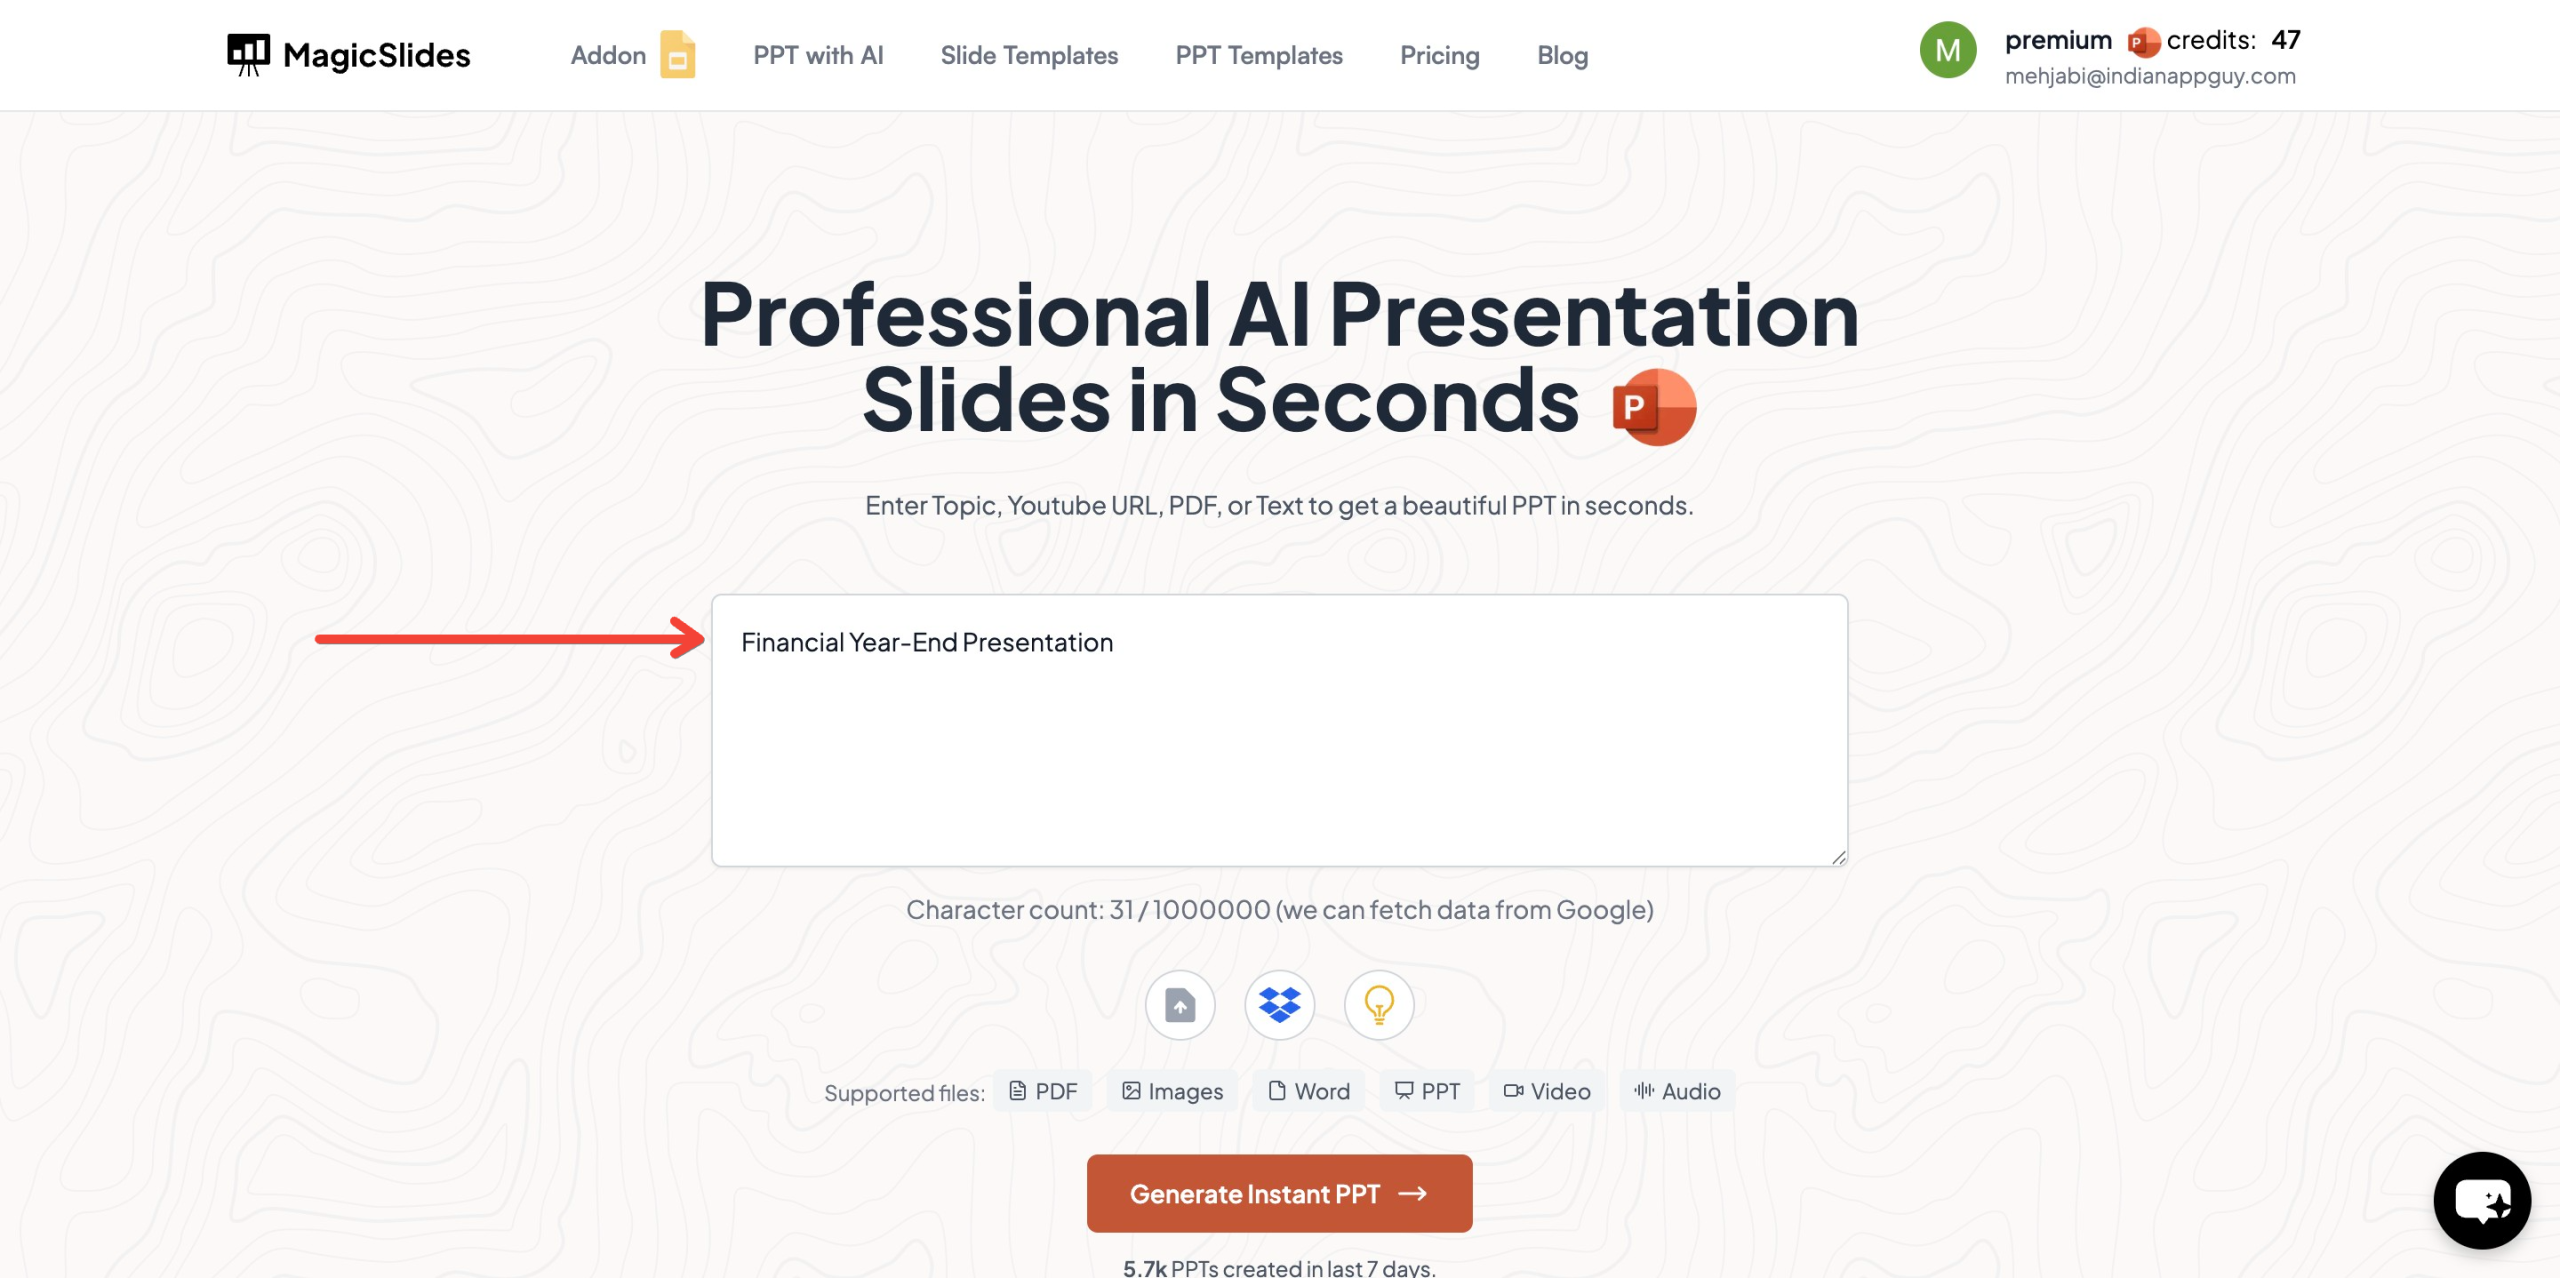
- Click Generate Instant PPT – The AI will generate slides based on your input.
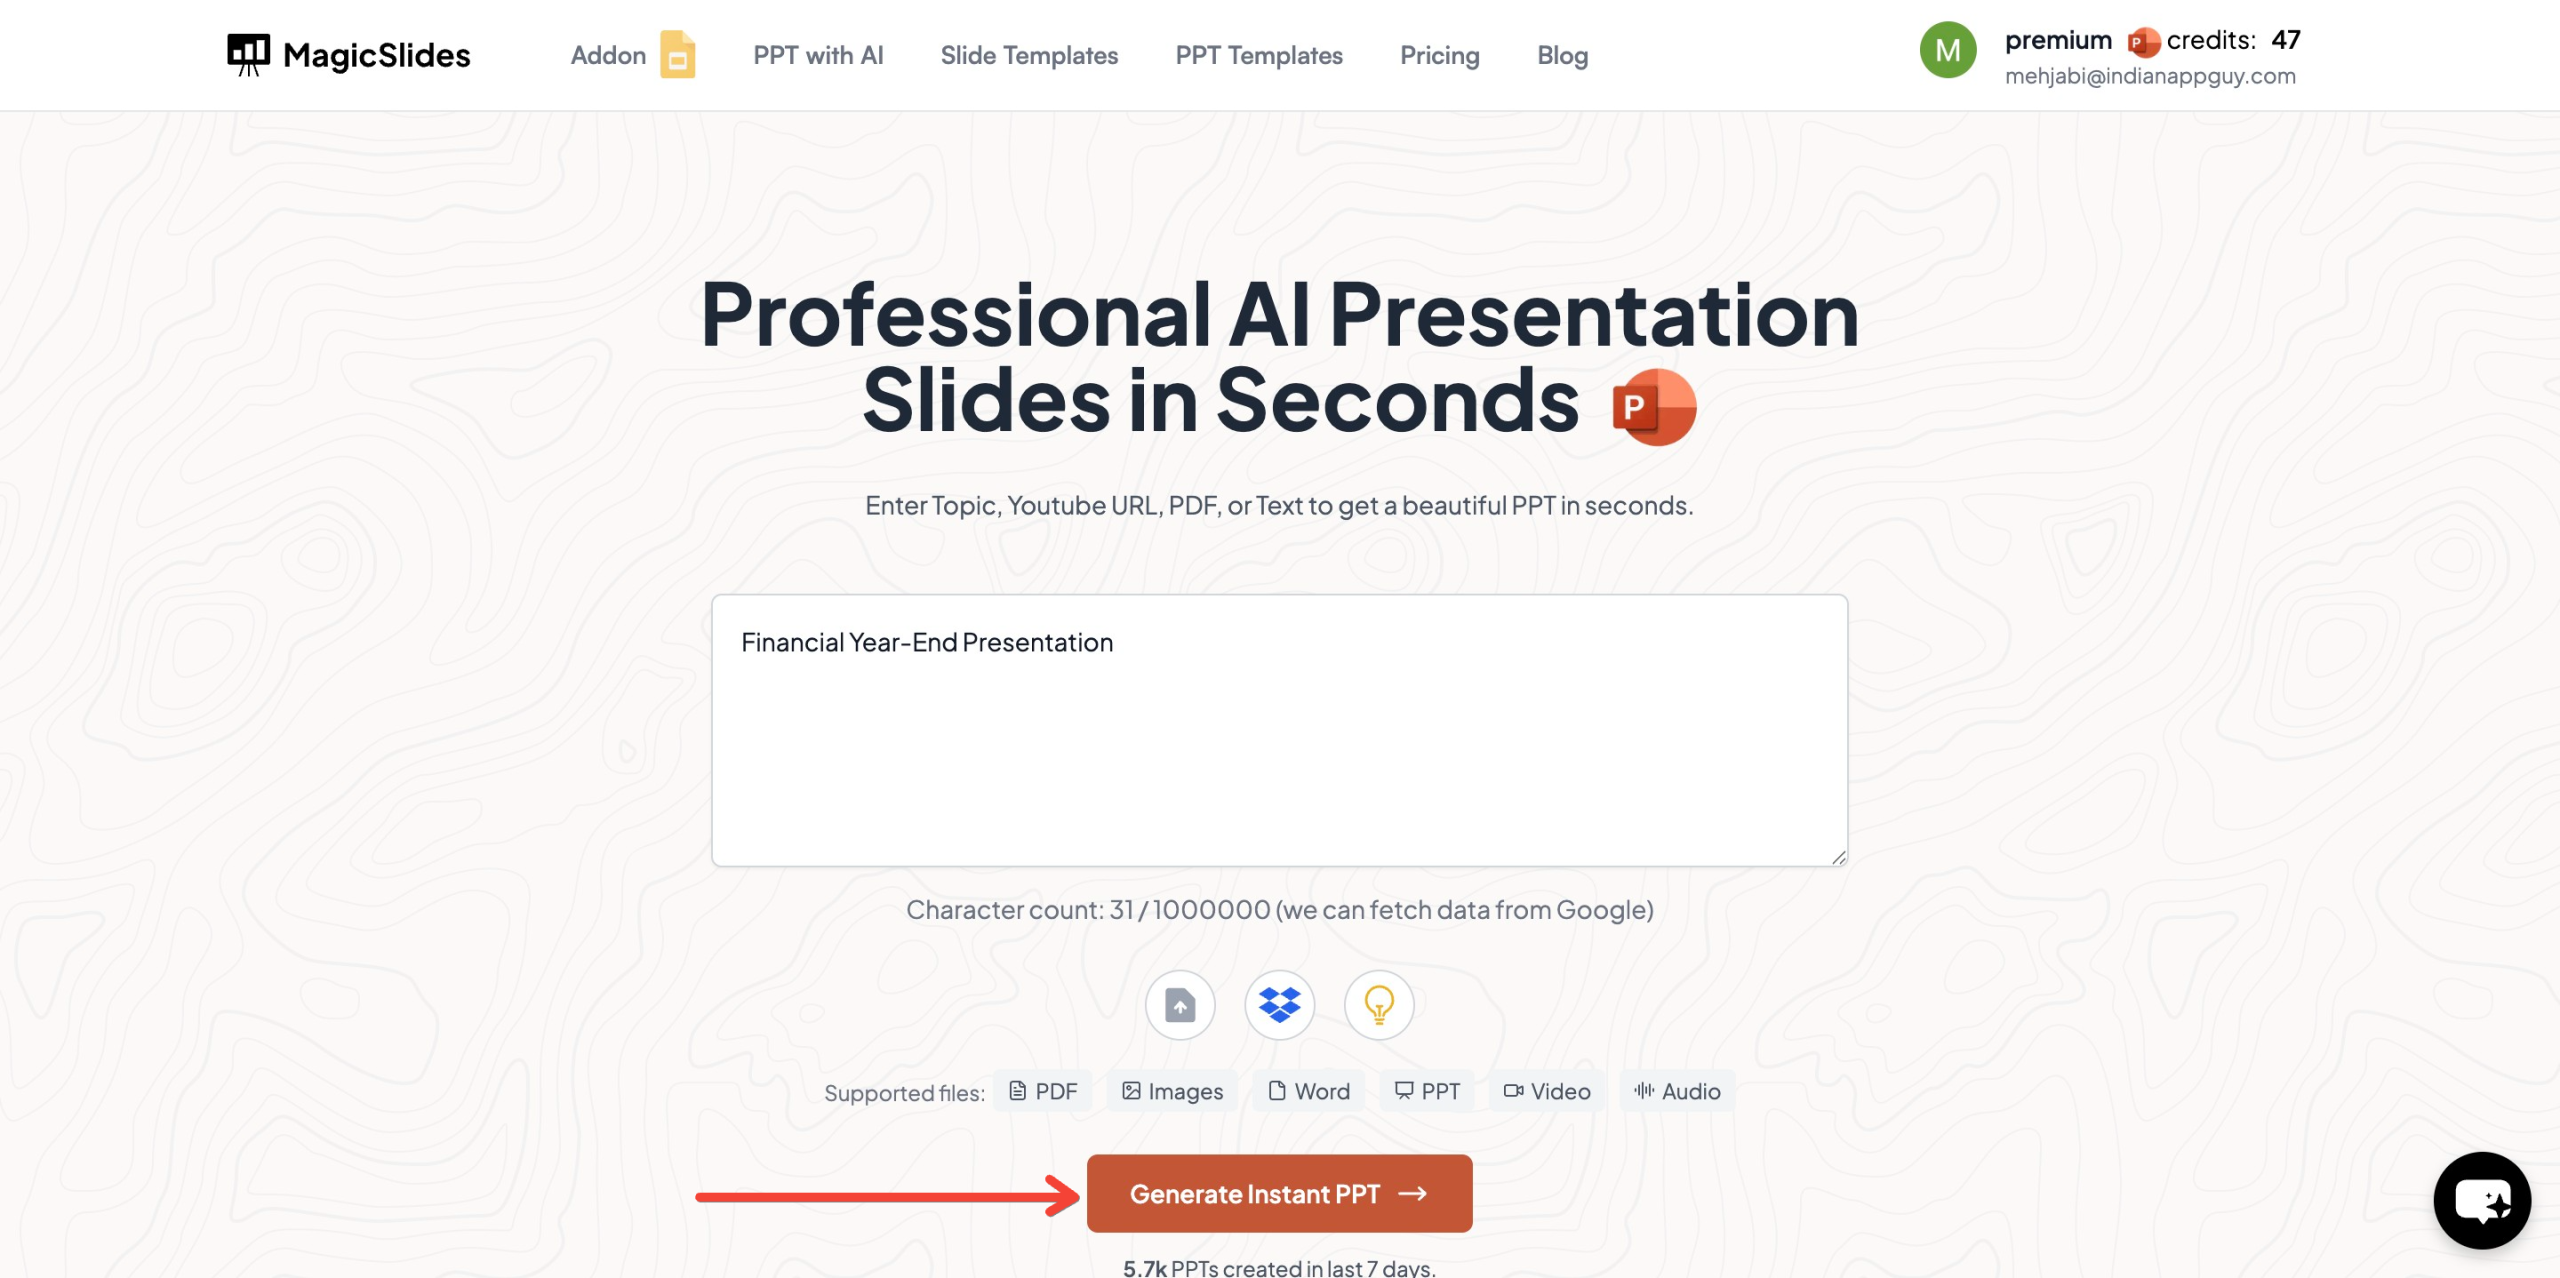
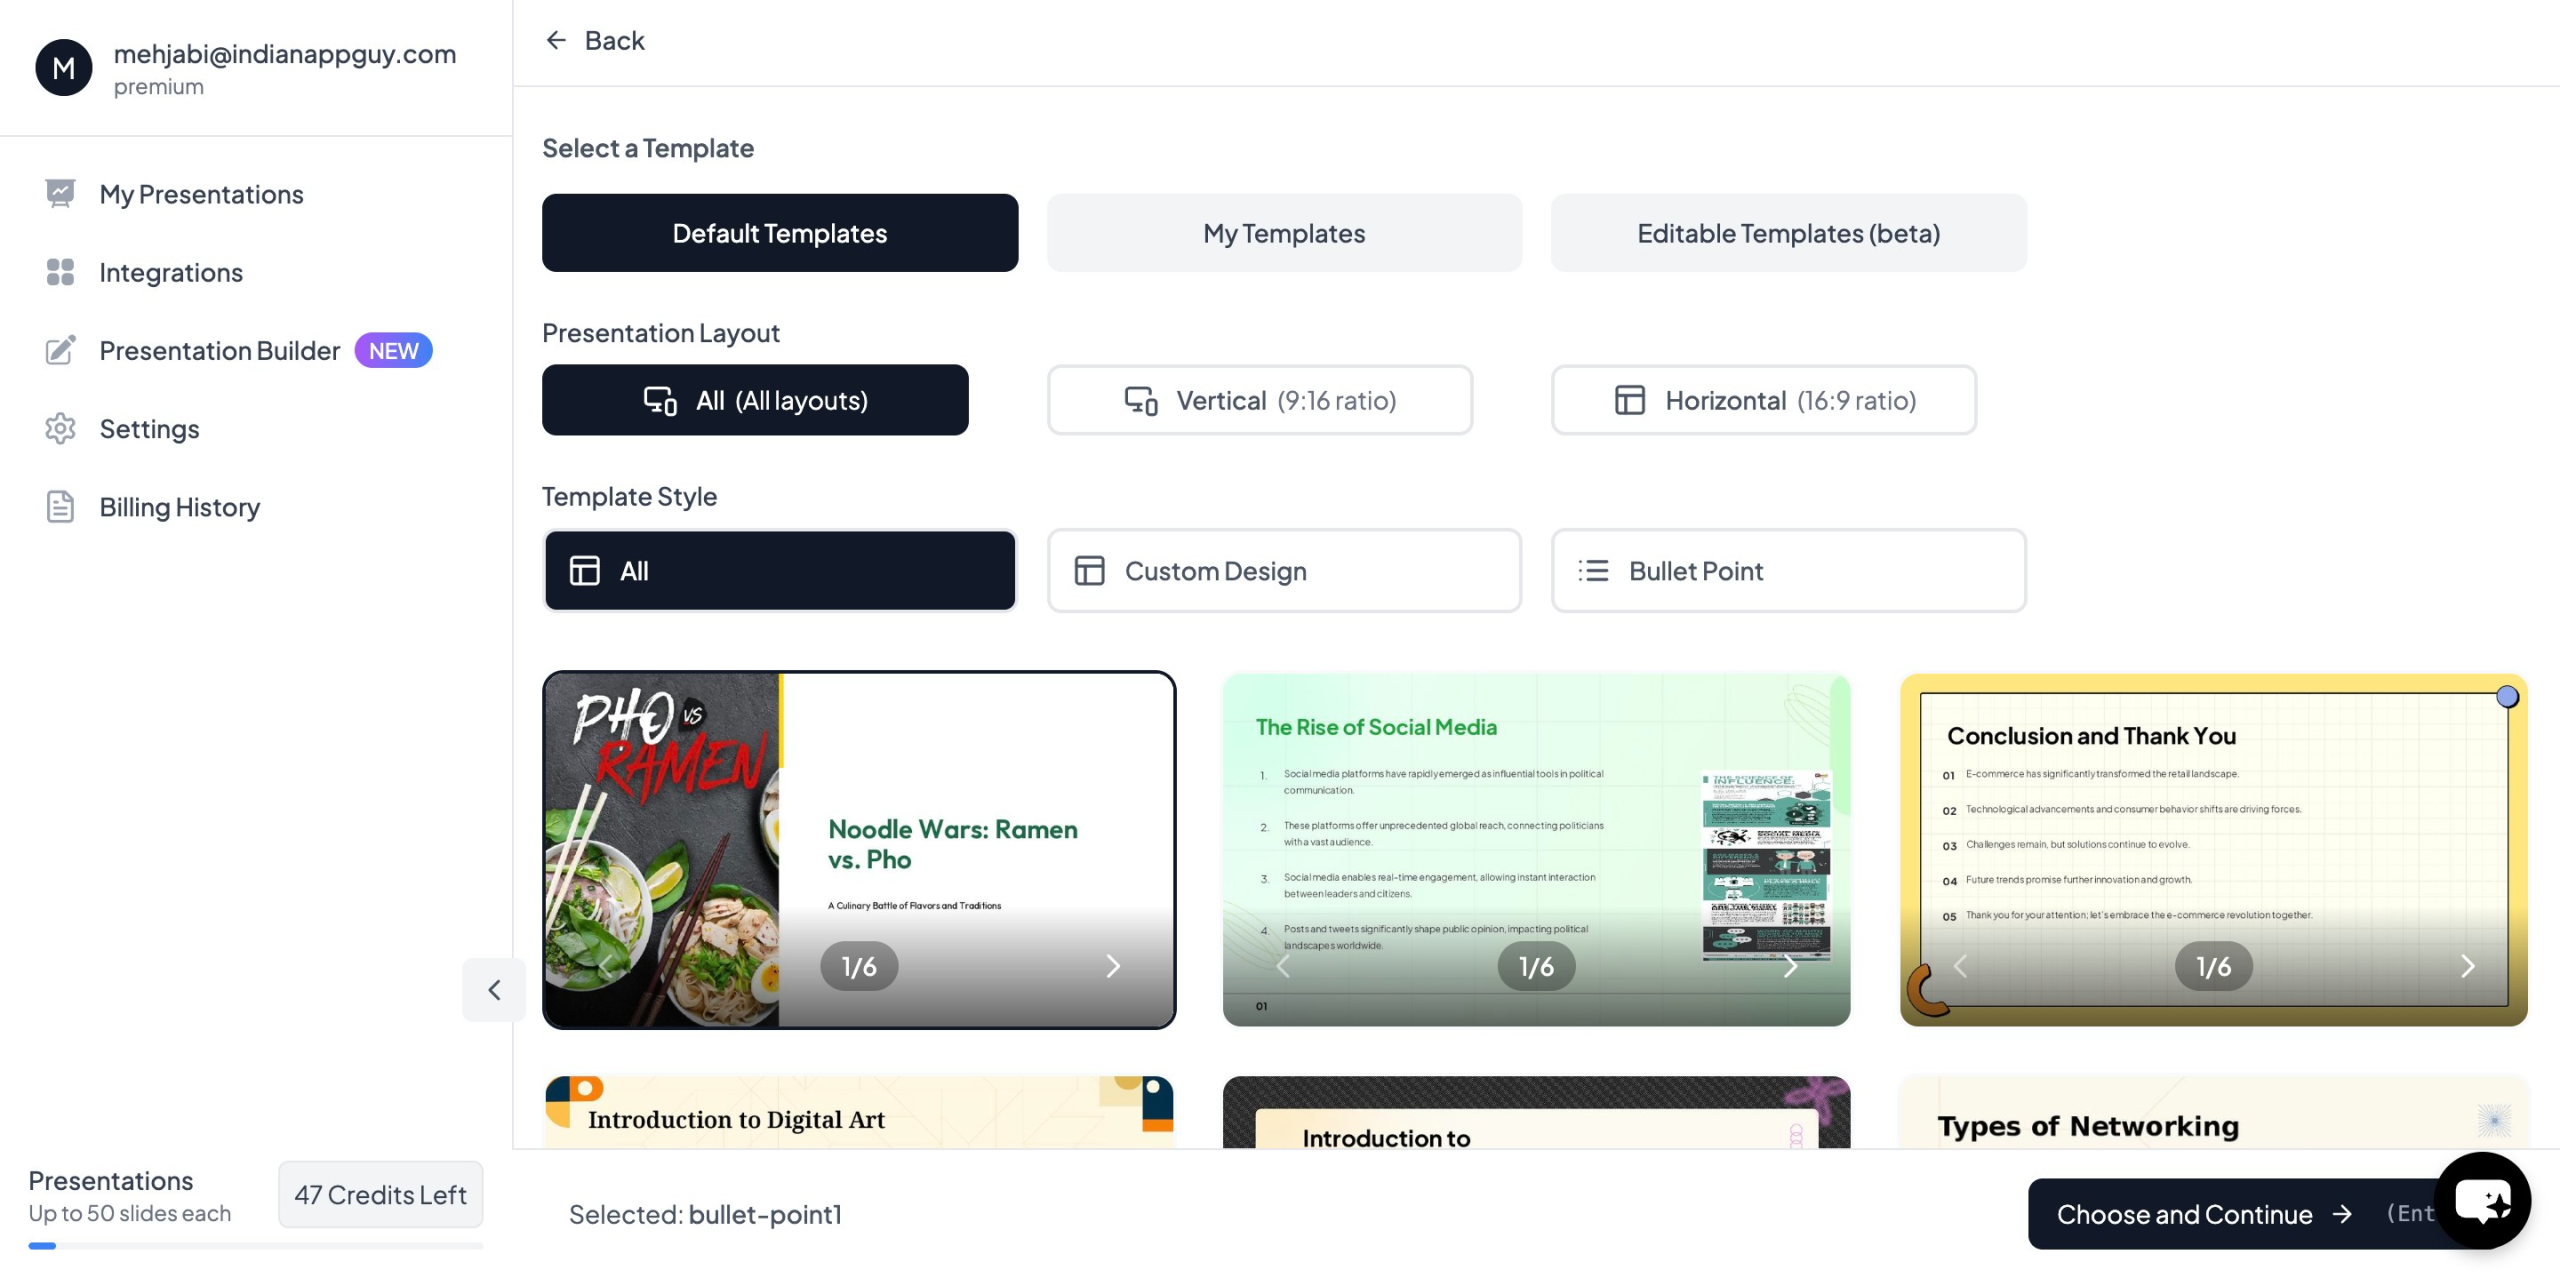
- Choose Your Template and Number of Slides – Customize your presentation by selecting a preferred design and the number of slides required.
- Click Generate Instant PPT – The tool will create a fully formatted PowerPoint presentation within seconds.
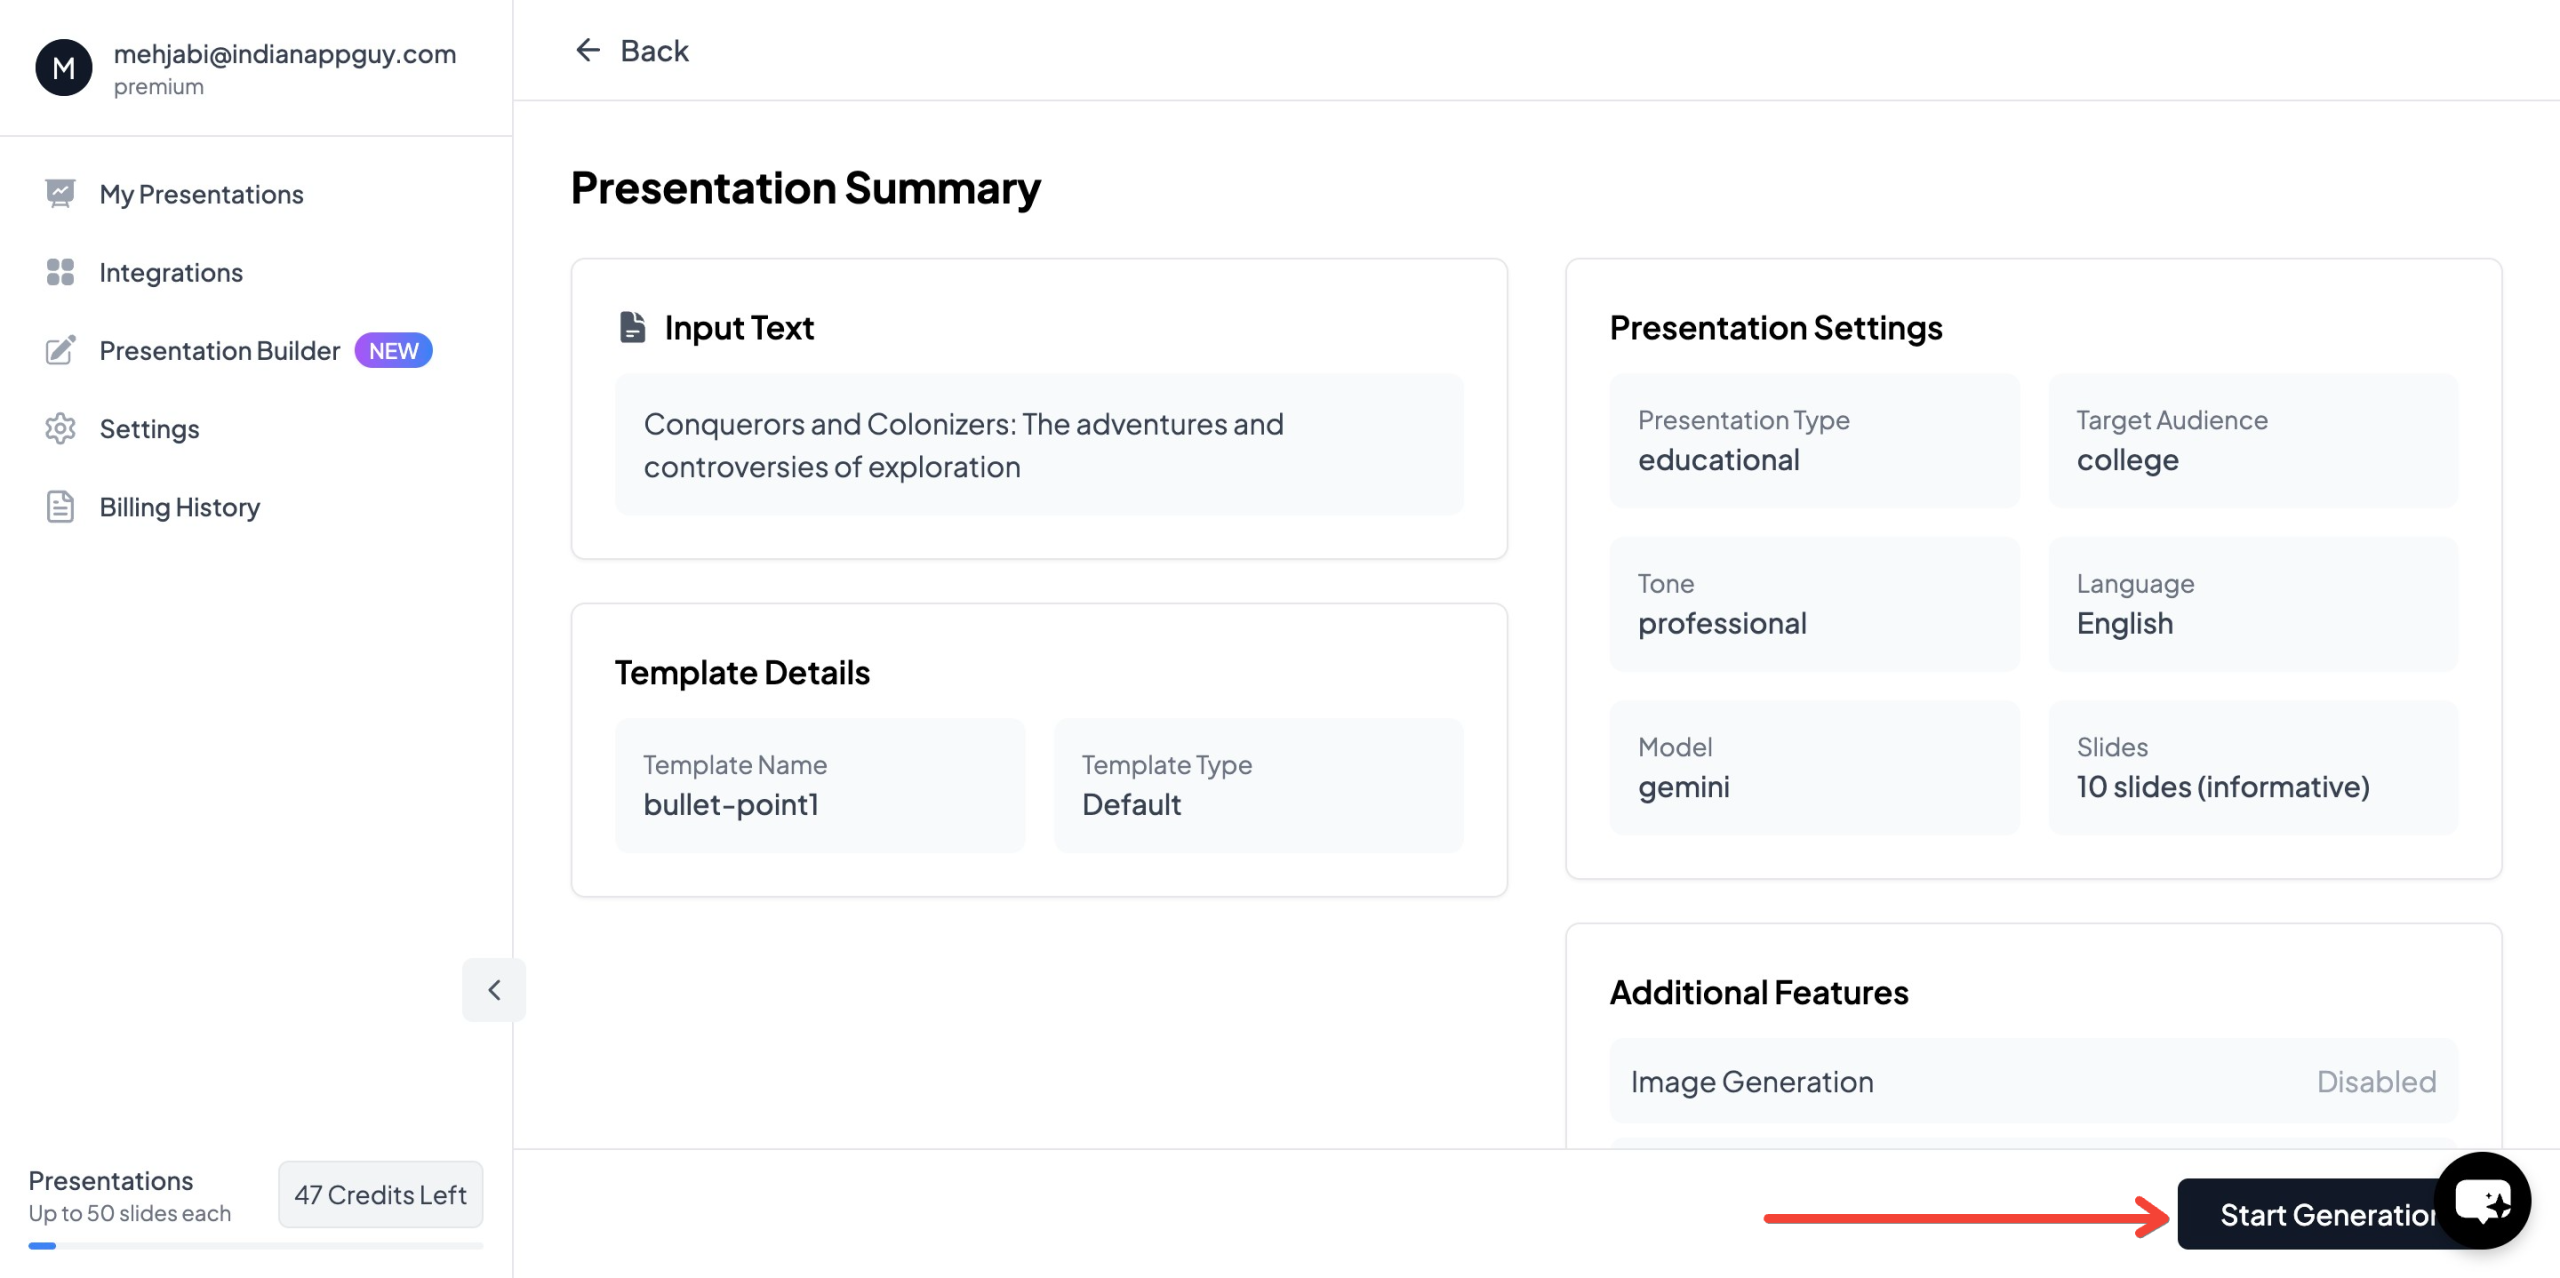
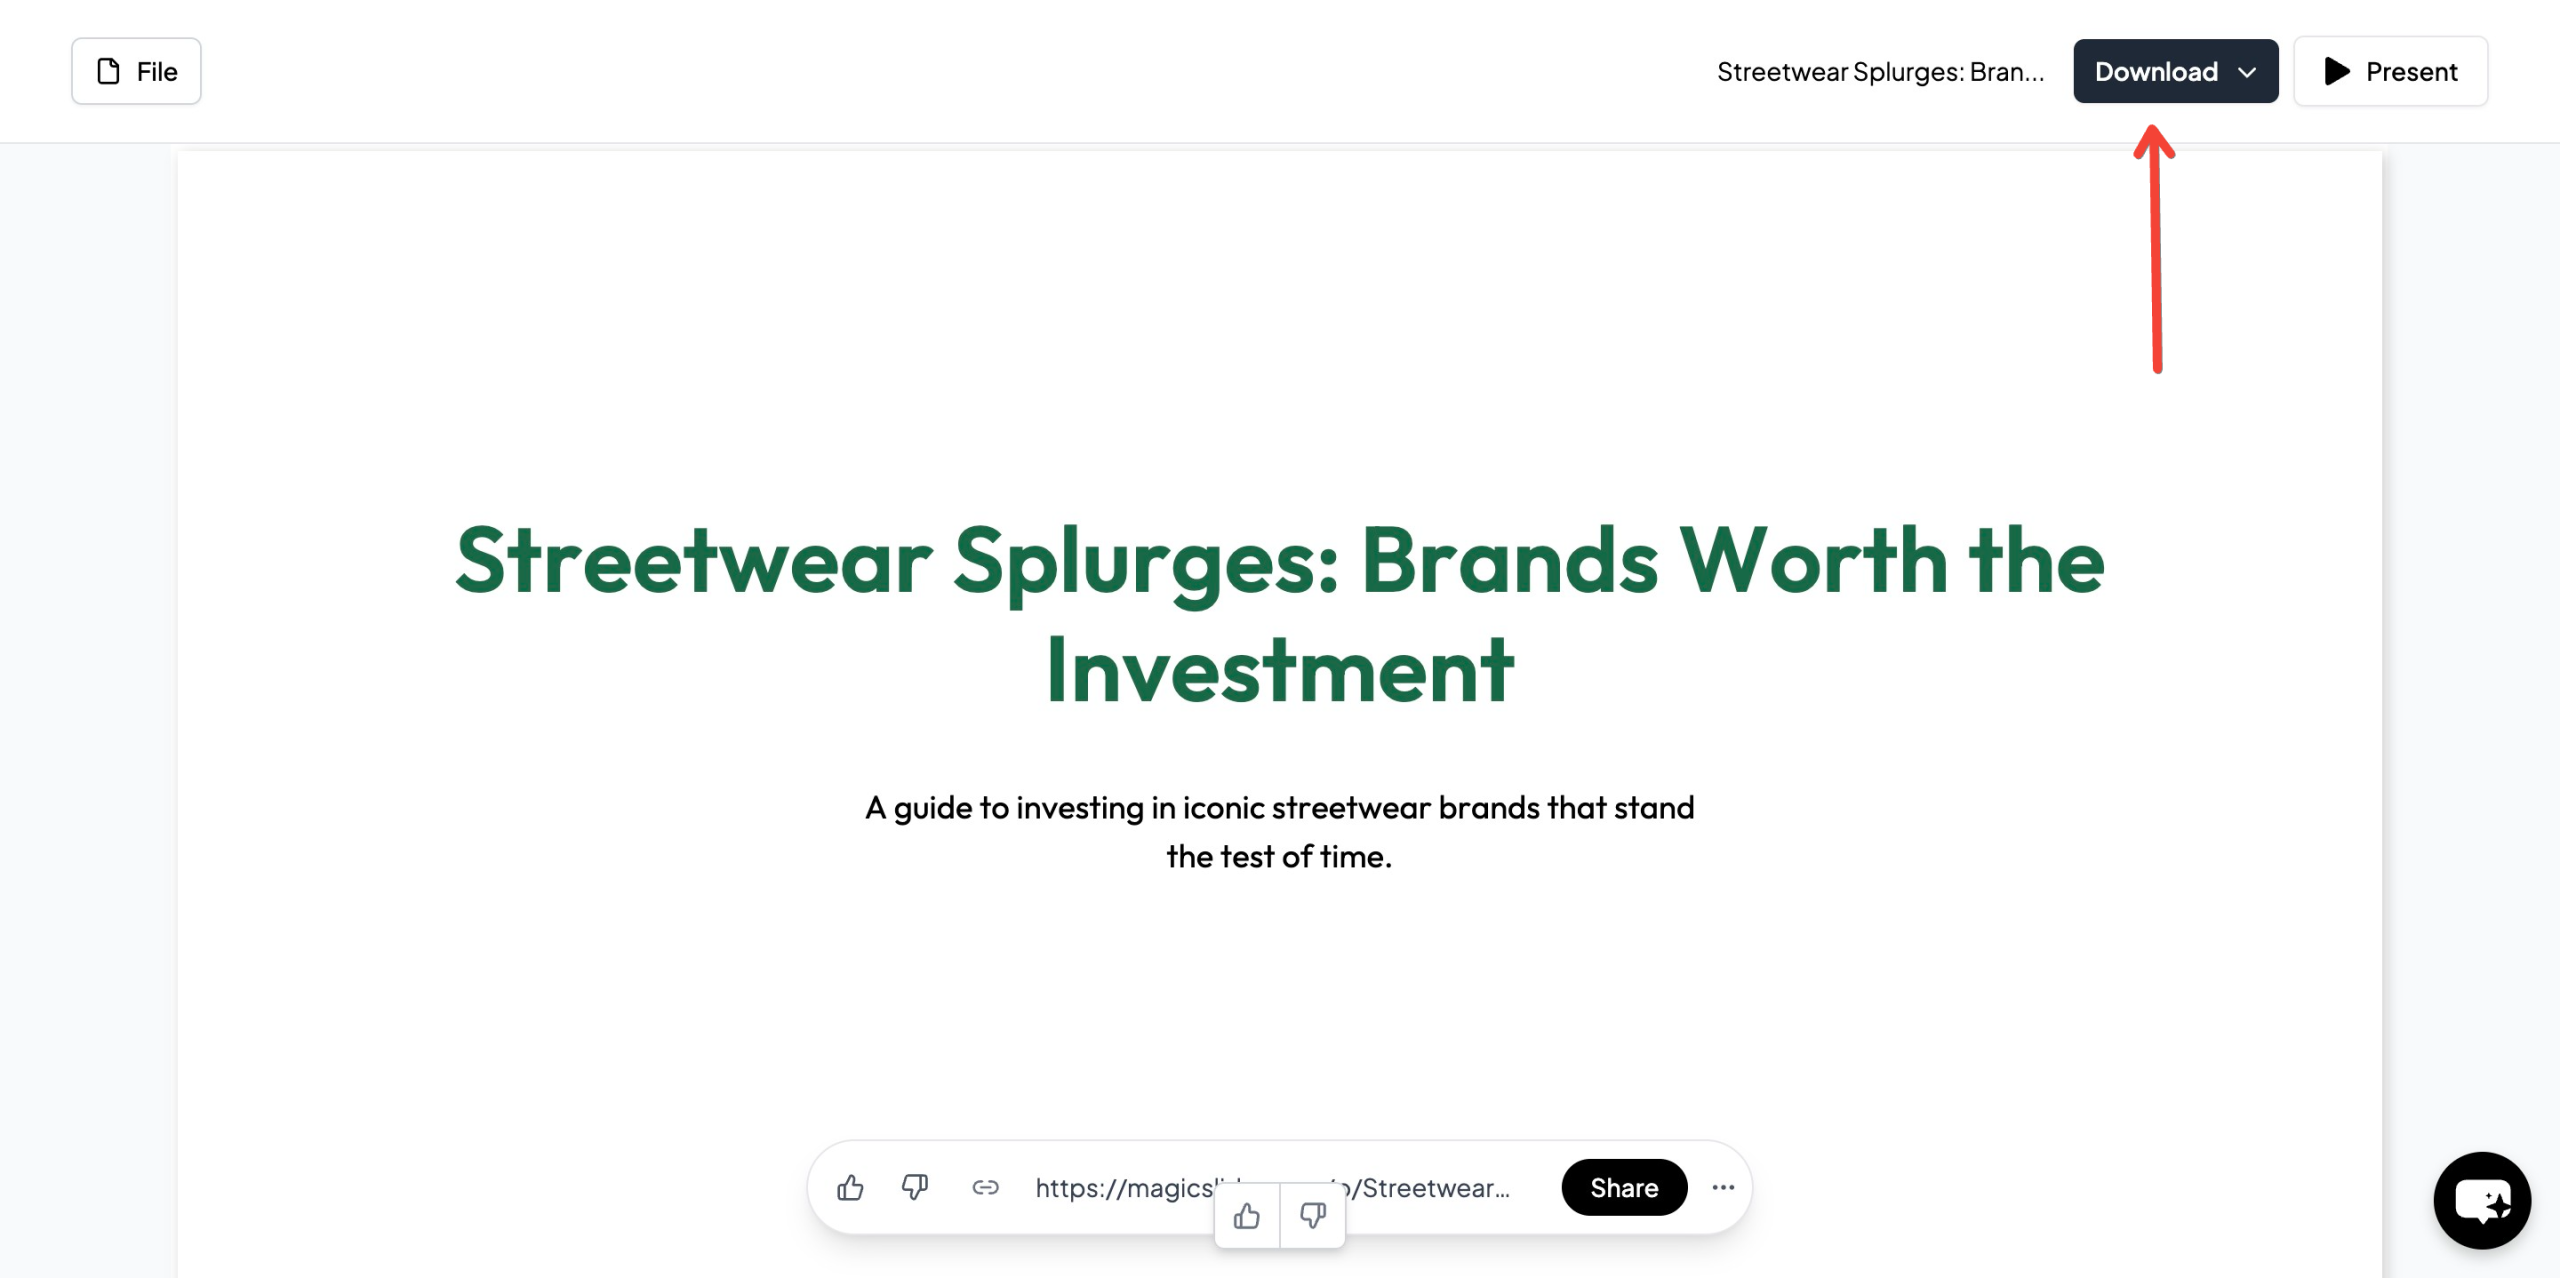
- Download and Edit – Once the slides are generated, download them and make any final adjustments before presenting.
MagicSlides.app helps businesses save time and ensures a professional, well-structured presentation with minimal effort.
ChartAI – The AI-Powered Chart Generator in MagicSlides
ChartAI is a powerful feature within MagicSlides.app that allows users to generate interactive and visually appealing charts effortlessly. Whether you need financial charts, sales trends, or market analysis visuals, ChartAI simplifies the process with AI-driven automation.
Follow These Steps to Generate AI-Powered Charts with ChartAI:
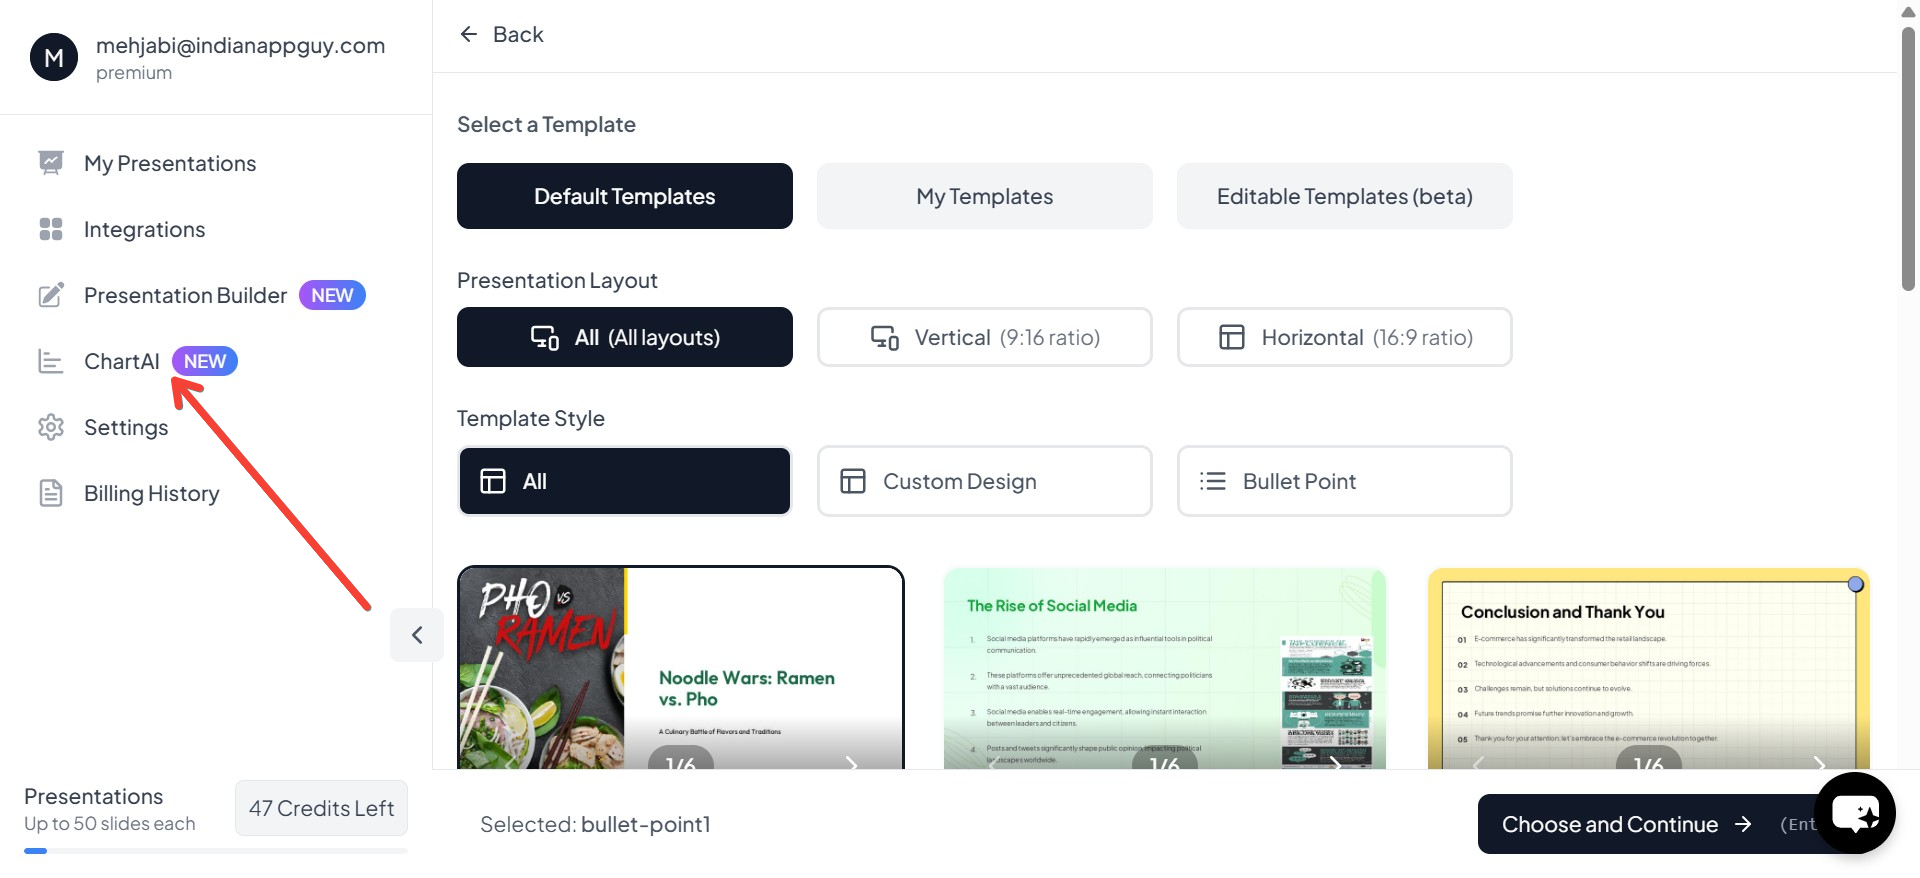
- Visit ChartAI within MagicSlides – After clicking "Generate PPT" in MagicSlides, navigate to the ChartAI feature that appears in the next step.
- Enter Your Prompt – Type a simple description of the chart you need, such as "Generate a bar chart comparing Q1 revenue for 2022 and 2023" or "Create a pie chart showing the percentage of budget allocation across departments."
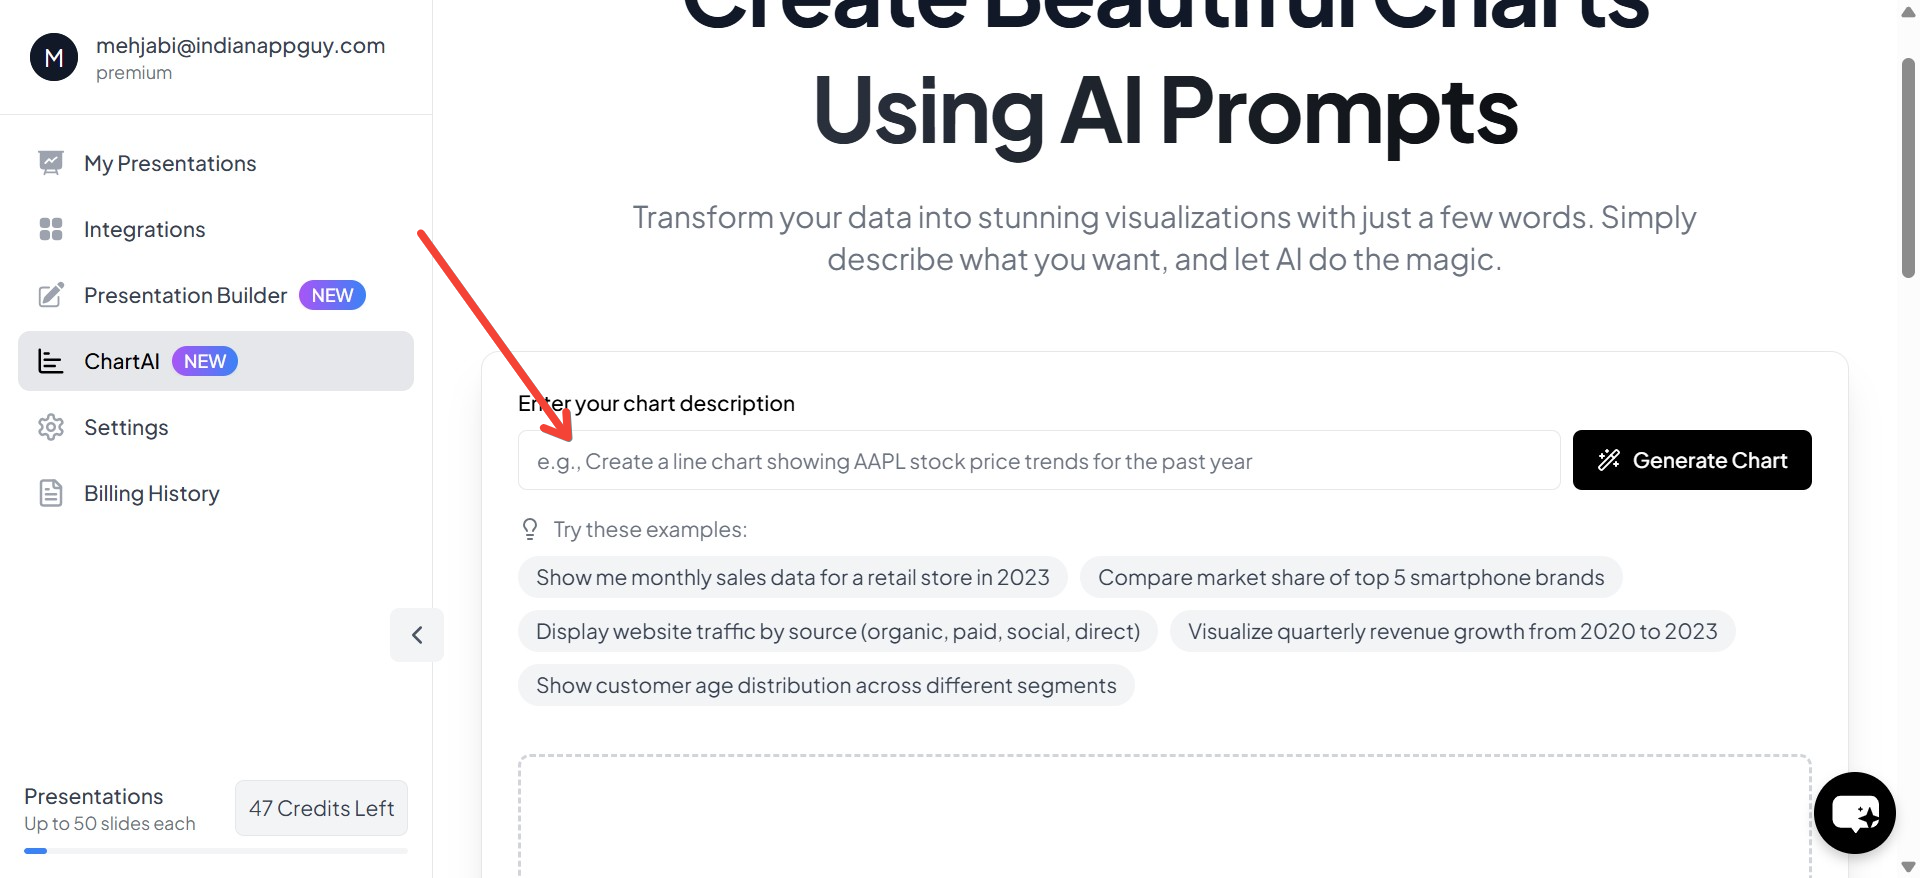
- Click "Generate Chart" – The AI will process your input and create a data-driven chart based on your description.
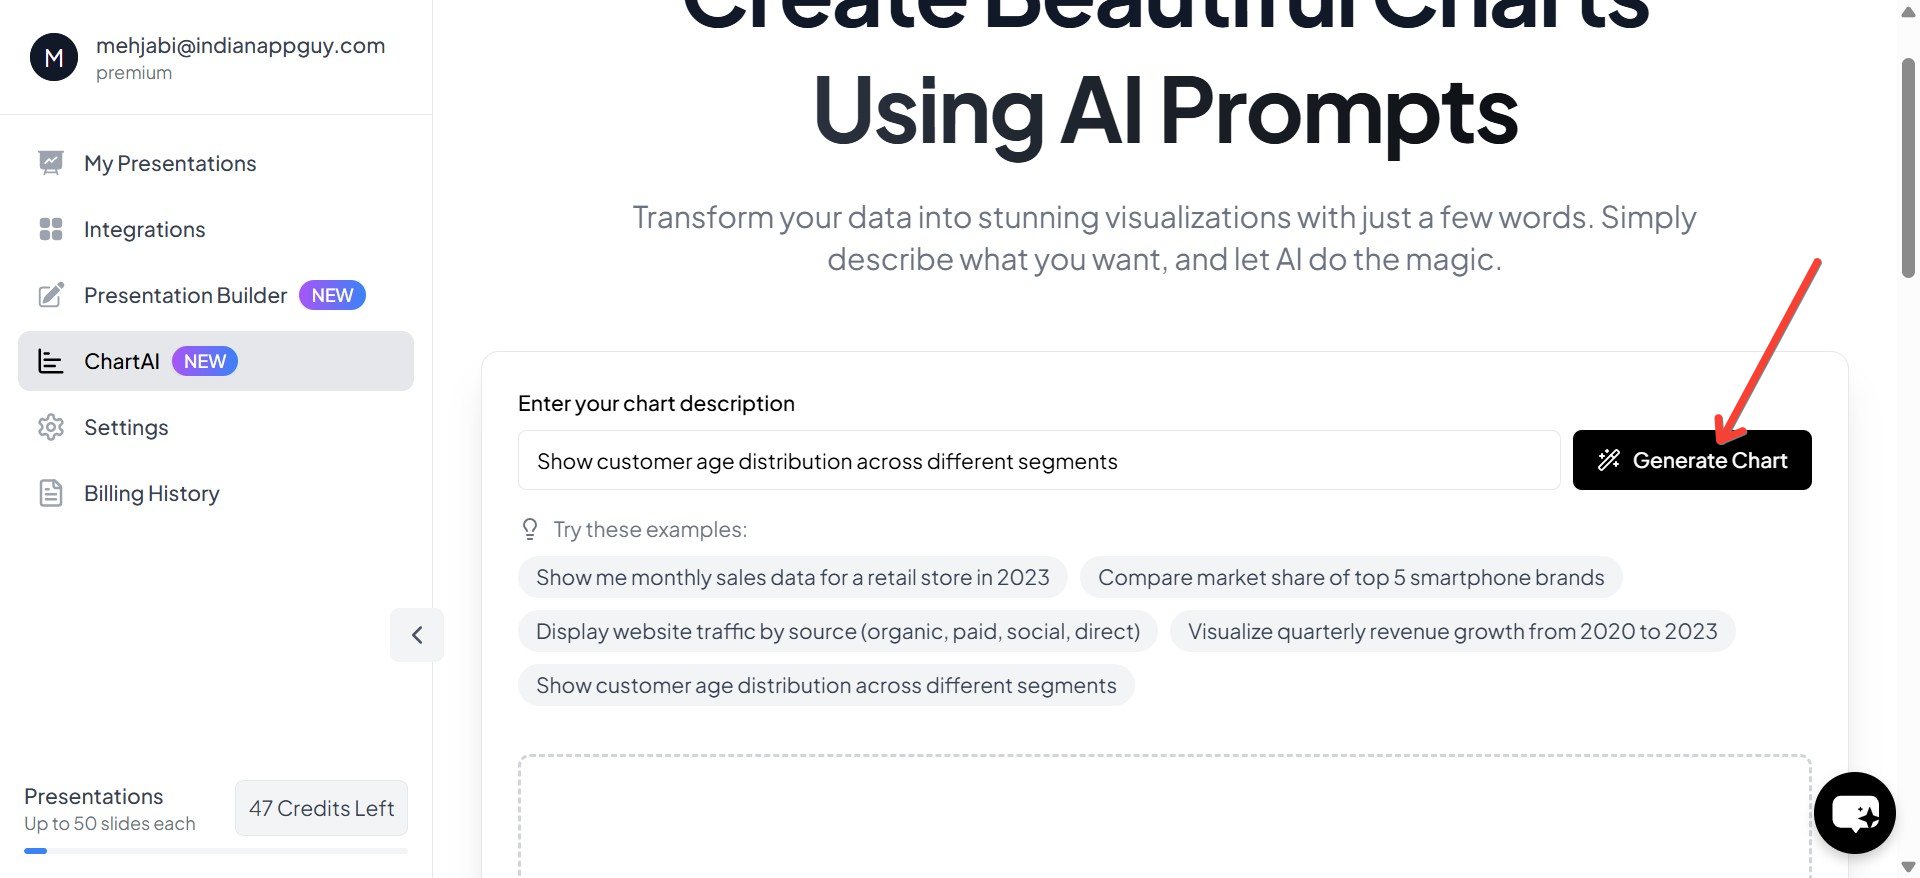
- Your Charts Will Be Generated – Within seconds, ChartAI will provide a professional, visually optimized chart that can be directly inserted into your presentation.
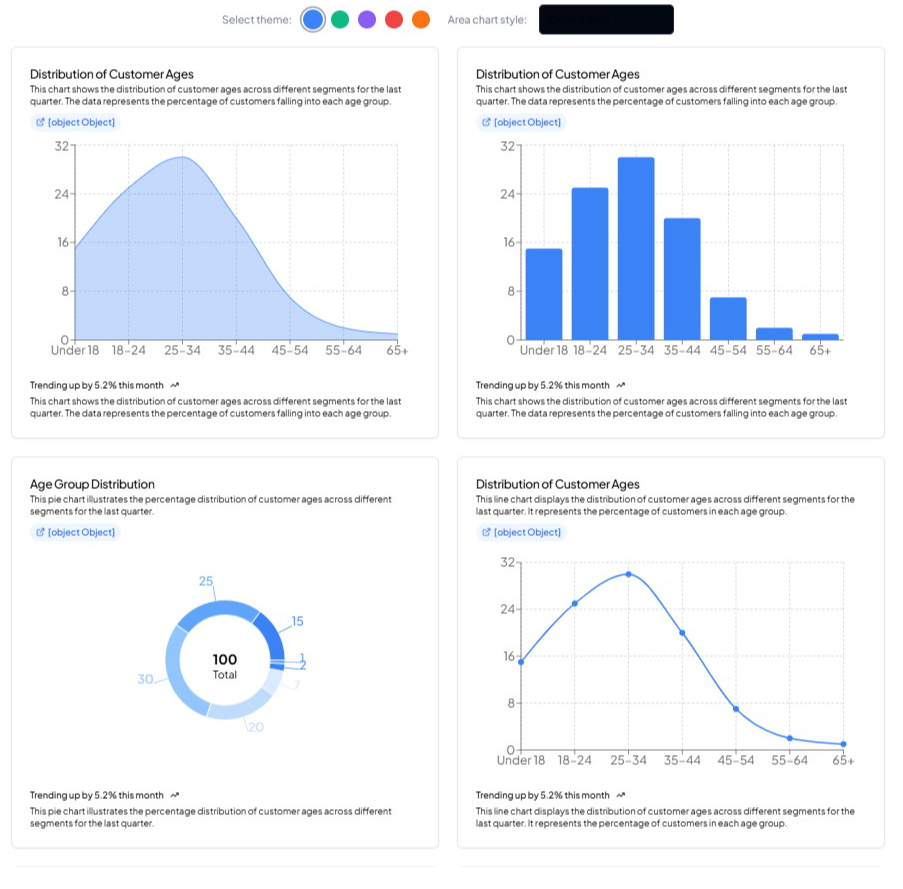
💡 Tip: You can customize the generated chart by tweaking data points, selecting different styles, or modifying labels to match your branding.
👉 Use ChartAI to create impactful, data-rich presentations effortlessly! 🚀
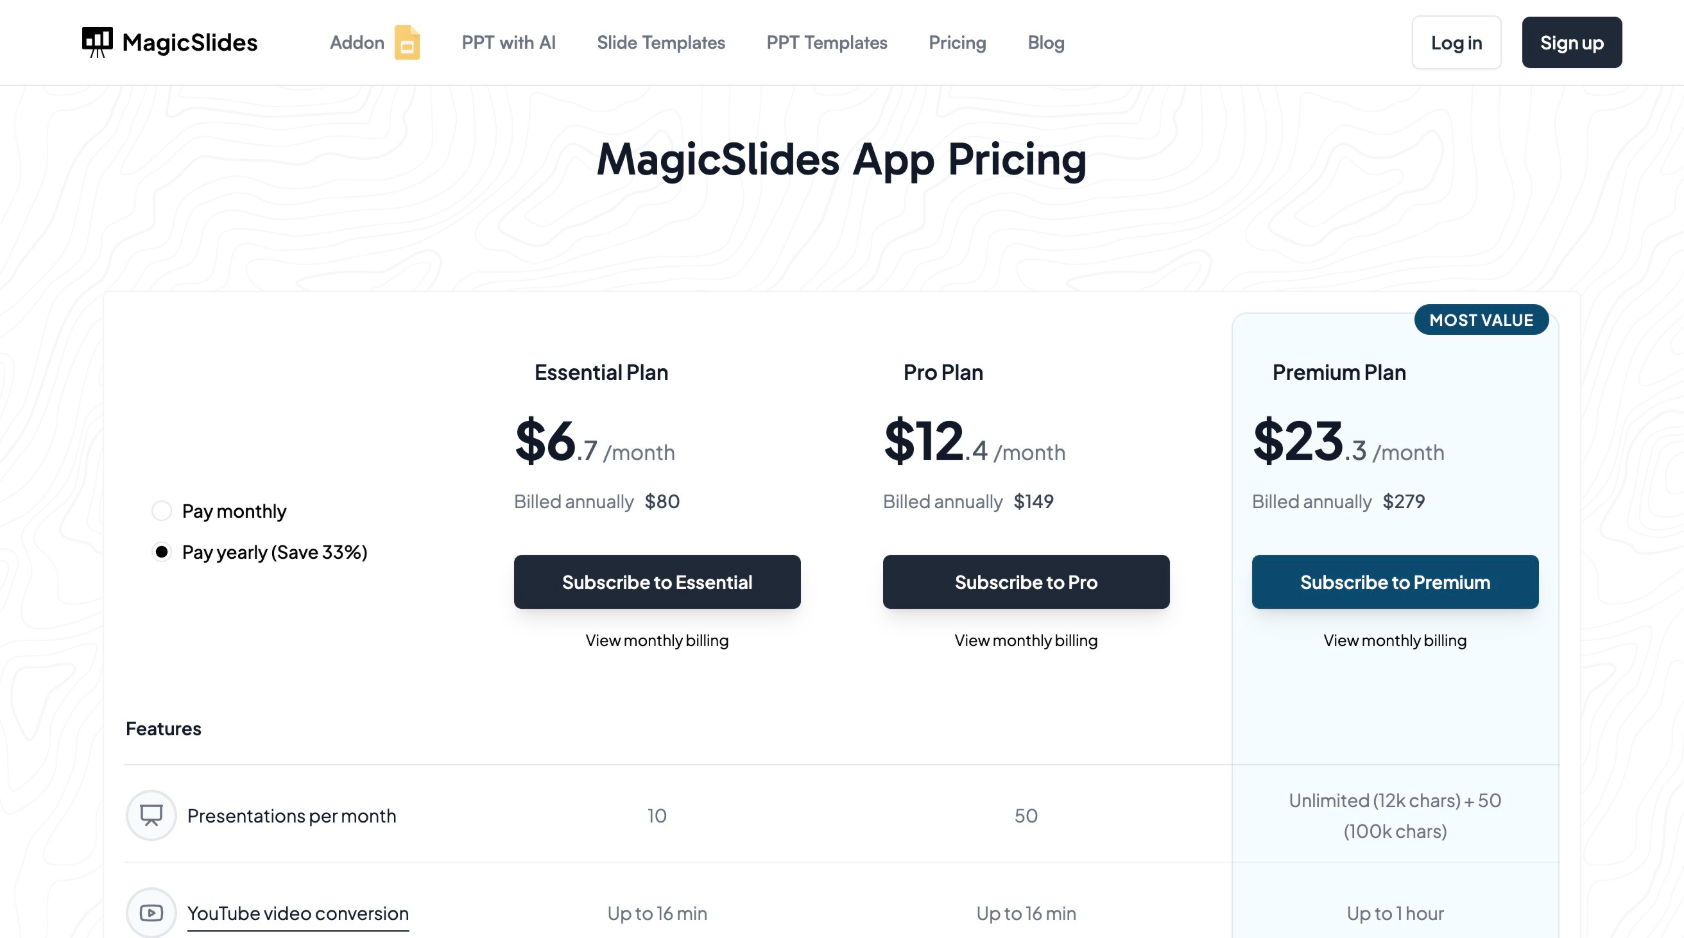
MagicSlides App Pricing and Features
MagicSlides offers different pricing plans to accommodate various user needs. Below is a breakdown of the plans available:
Final Thoughts
Creating a compelling financial year-end presentation requires a structured approach, clear financial data, and engaging visuals. By following the recommended structure and using AI tools like MagicSlides.app, you can streamline the process and ensure a professional presentation that effectively communicates your company’s financial health.
Whether you are a small business owner, financial analyst, or corporate executive, leveraging technology can save time and enhance the impact of your financial reports. Consider MagicSlides.app to automate slide creation and focus on delivering insights that matter.
For more details, visit MagicSlides.app and explore the available plans to find the best fit for your needs.


