How to create flow chart in PowerPoint


Effortlessly create professional flowcharts in PowerPoint with this simple step-by-step guide for beginners.
Flowcharts are powerful tools for visualizing processes, workflows, and decision-making pathways. In PowerPoint, you can create professional-looking flowcharts to effectively communicate complex information to your audience. In this step-by-step guide, we'll walk through the process of creating a flowchart in PowerPoint, from setting up your slide to adding shapes and connectors.
How to create flow chart in PowerPoint
Step 1: Open PowerPoint and Create a New Slide
Launch PowerPoint and open a new presentation or the existing one where you want to create the flowchart. Choose a blank slide to start designing your flowchart.
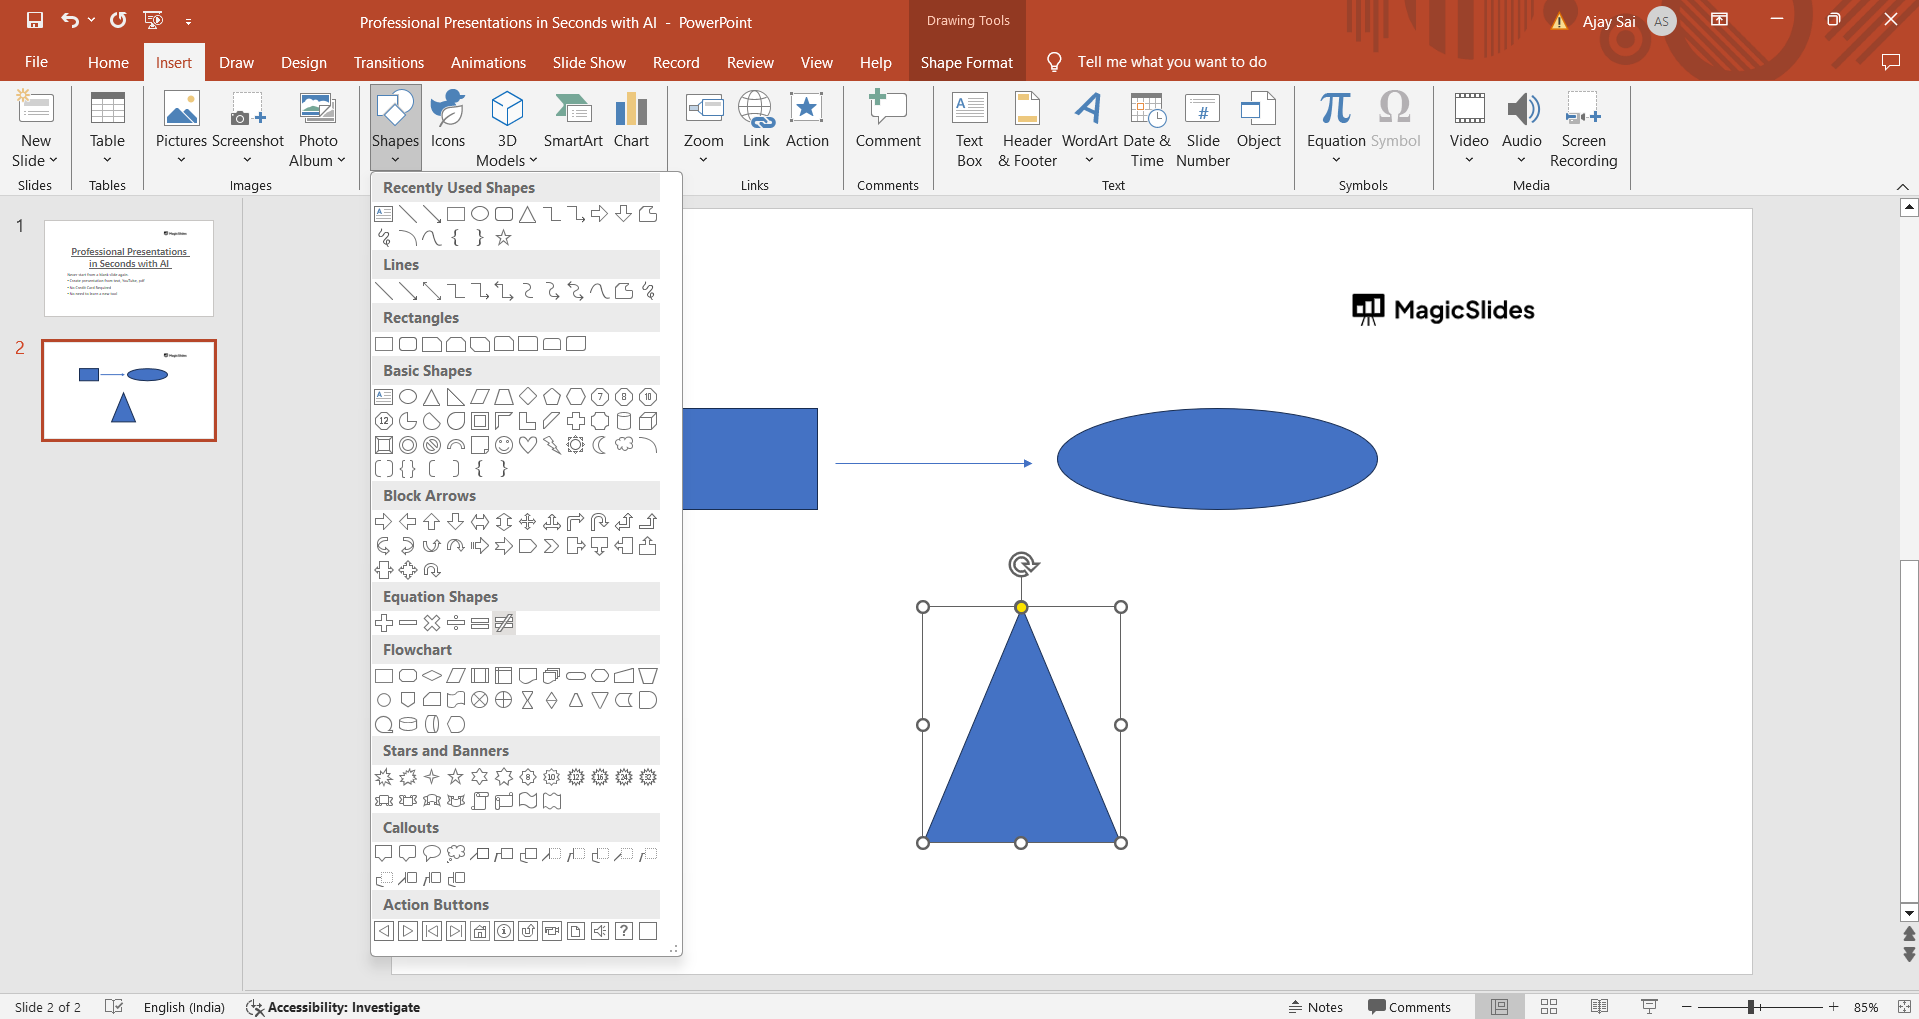
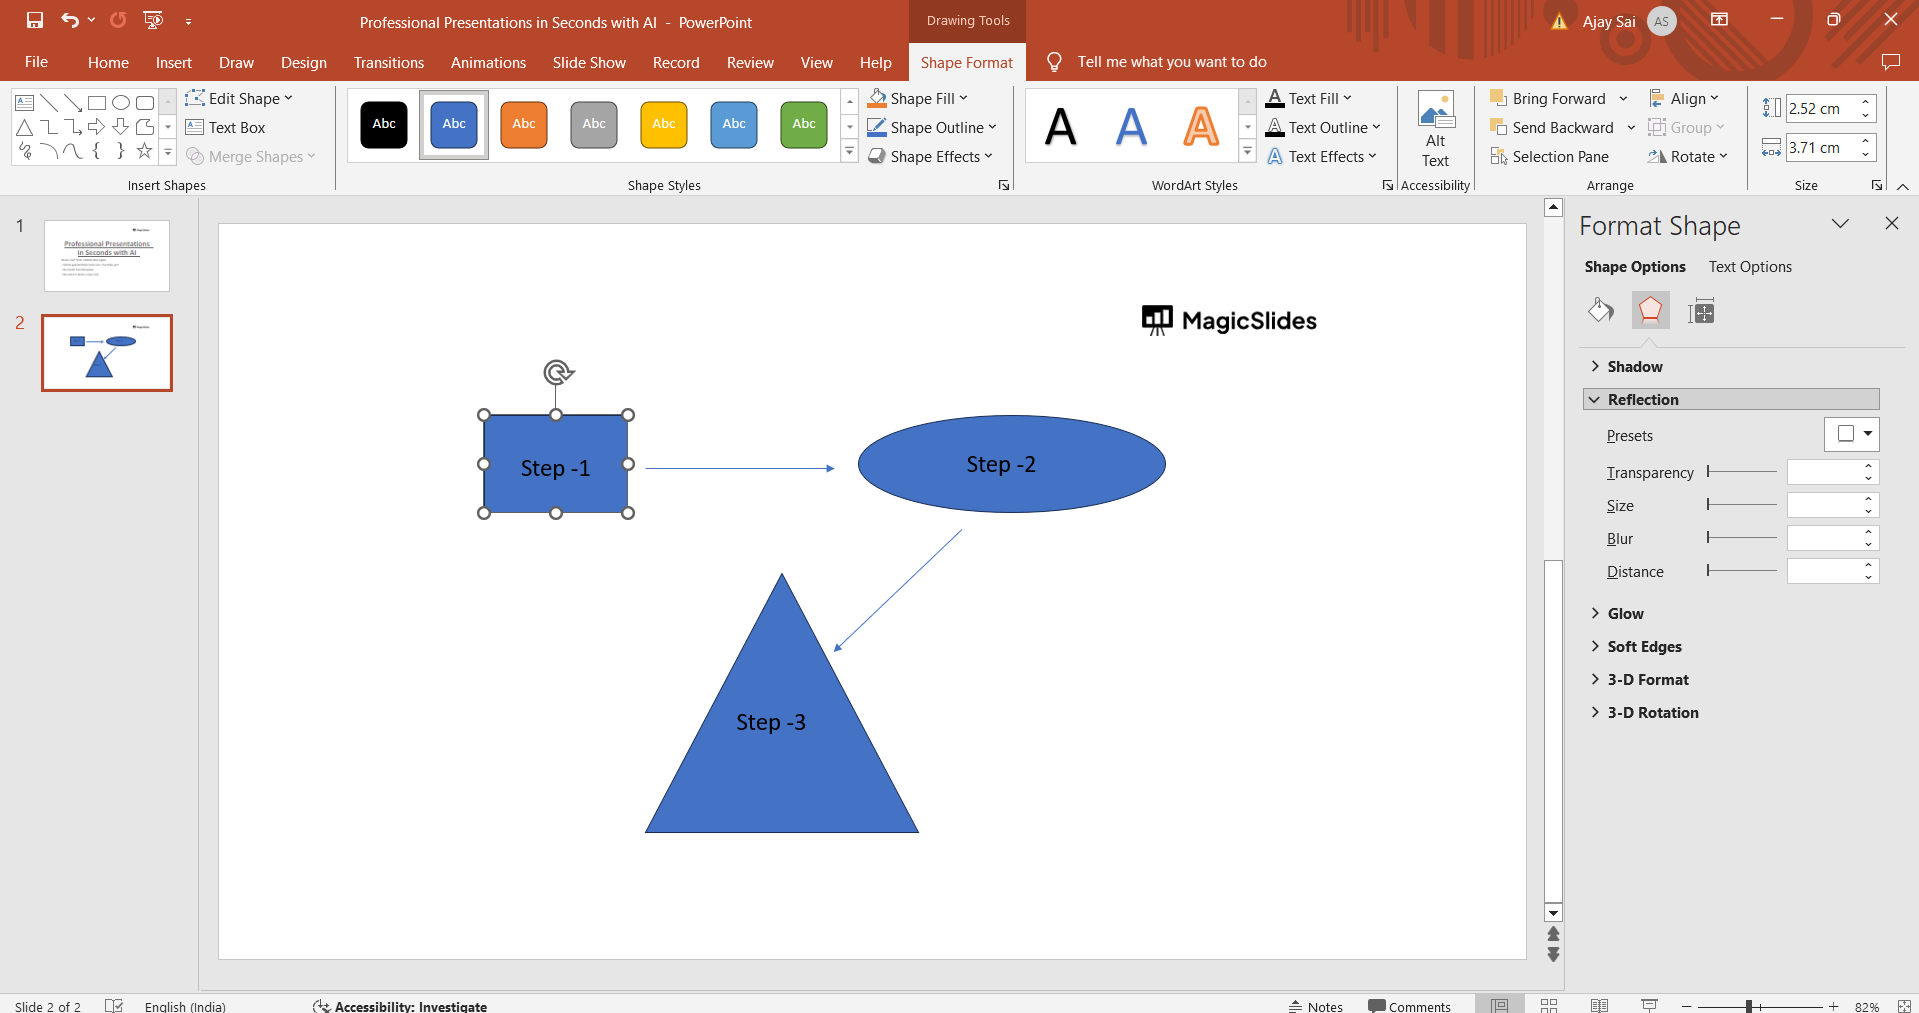
Step 2: Insert Shapes for Flowchart Elements
Click on the "Insert" tab in the PowerPoint ribbon. Then, click on "Shapes" to access a dropdown menu of shape options. Choose the appropriate shapes for your flowchart elements such as rectangles for processes, diamonds for decisions, and arrows for connectors.
Step 3: Draw and Customize Flowchart Shapes
Click and drag on the slide to draw the first shape for your flowchart element. Customize the shape's size, color, and text by right-clicking on the shape and selecting options like "Edit Text" or "Format Shape" from the context menu.
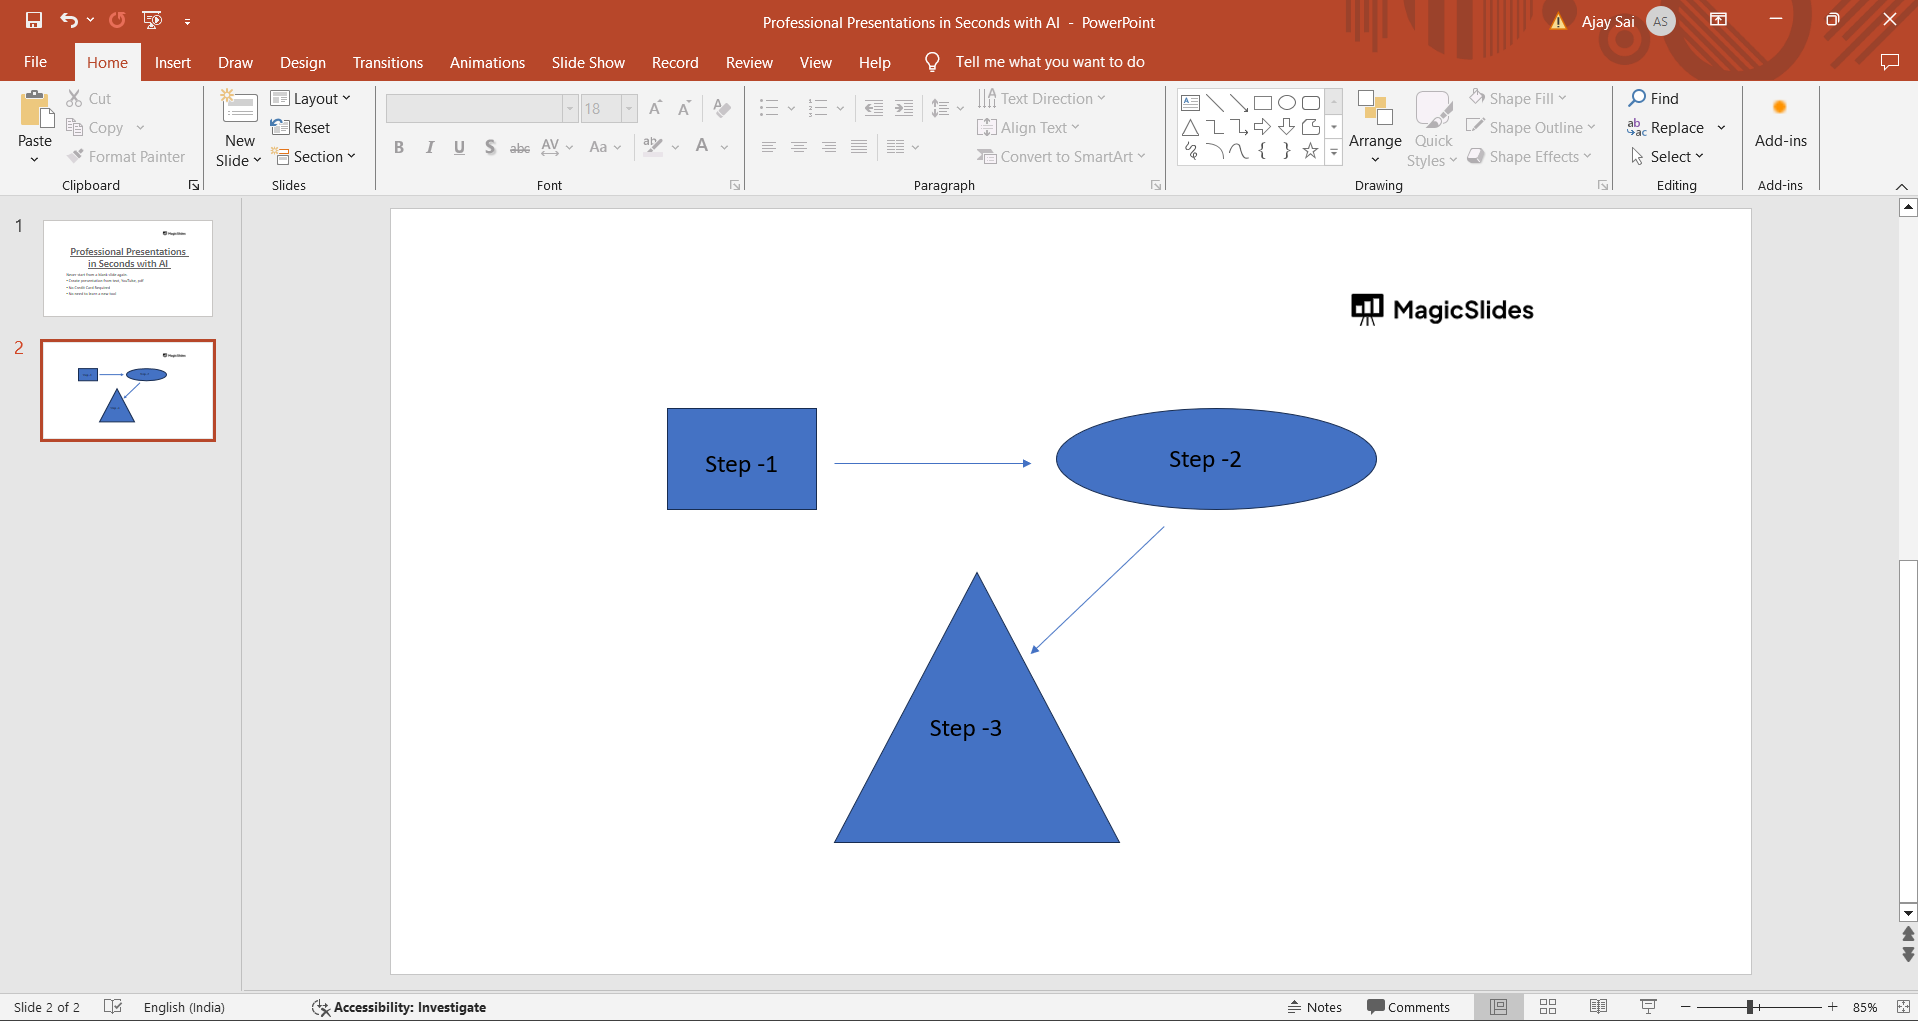
Step 4: Add Text to Flowchart Shapes
Double-click inside the shape to add text related to that particular step or decision in your process. Use clear and concise labels to ensure your flowchart is easy to understand.

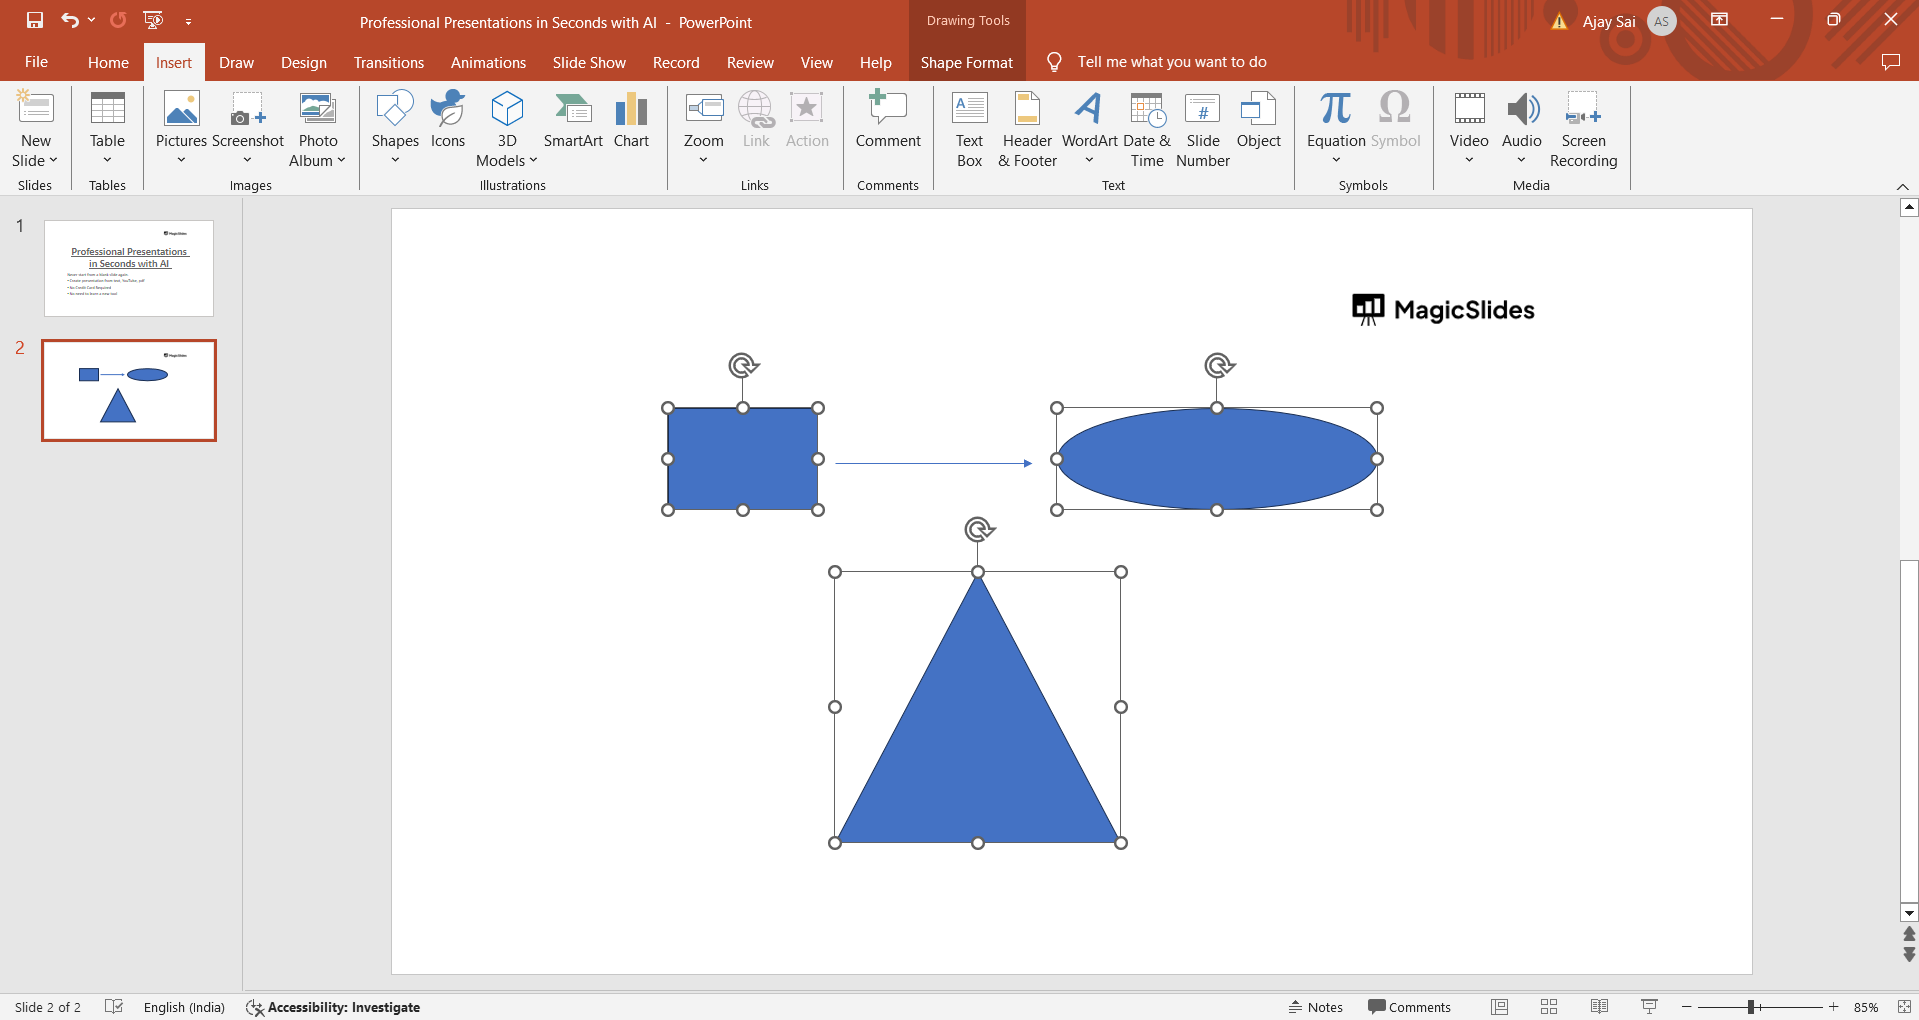
Step 5: Connect Flowchart Shapes with Arrows
To connect shapes and show the flow of your process, select the "Lines" or "Arrows" option from the Shapes menu. Click and drag from the connection points on one shape to another to create the desired flow of your flowchart.
Step 6: Arrange and Align Flowchart Elements
Arrange your flowchart elements on the slide by dragging them into the desired positions. Use PowerPoint's alignment and distribution tools under the "Format" tab to ensure your flowchart looks neat and organized.
Step 7: Add Additional Details and Formatting
Enhance your flowchart by adding titles, labels, and additional text boxes as needed. Use formatting options such as colors, fonts, and styles to make your flowchart visually appealing and easy to follow.
Conclusion:
Creating a flowchart in PowerPoint is a straightforward process that can significantly improve the clarity and effectiveness of your presentations, especially when explaining complex processes or workflows. By following this step-by-step guide, you can design professional-looking flowcharts that engage your audience and help them understand the sequential steps or decision points in your content. Incorporate these flowchart creation techniques into your PowerPoint toolkit to enhance your visual communication skills and deliver impactful presentations.
→ To make your Presentations more visually appealing, add a timeline showcasing different milestones. checkout this quick tutorial after creating a flowchart to add a timeline from here: https://www.magicslides.app/blog/How-to-insert-timeline-in-powerpoint
Frequently Asked Questions:
Can I use pre-designed flowchart templates in PowerPoint
Yes, PowerPoint offers a variety of built-in flowchart templates that you can access from the "New Slide" or "Insert" menu. These templates can save you time and provide a starting point for your flowchart designs.
How do I add images or icons to my flowchart in PowerPoint?
You can easily insert images or icons into your flowchart by using the "Insert" > "Pictures" or "Icons" option in PowerPoint. Simply select the desired image or icon and place it next to or within the relevant flowchart shape.
Is it possible to animate my flowchart elements in PowerPoint?
Yes, PowerPoint allows you to add animations to individual flowchart shapes or entire flowchart sequences. Use the "Animations" tab to apply entrance, exit, or motion path animations to make your flowchart elements appear or transition dynamically during a presentation.
Can I collaborate with others on a flowchart project in PowerPoint?
PowerPoint supports collaboration through cloud-based platforms like Microsoft OneDrive or SharePoint. You can share your PowerPoint file with colleagues or team members, allowing them to view, edit, and comment on the flowchart content collaboratively.


