How to make a table in google slides


Enhance your Google Slides presentations with ease follow these steps to craft visually appealing and organized tables.
Tables are powerful tools for organizing information in a structured and visually appealing manner. In the world of presentations, Google Slides provides an easy-to-use platform for creating tables that enhance the overall clarity of your content. In this step-by-step guide, we'll walk you through the process of making tables in Google Slides, empowering you to present data and details with precision.
How to make a table in google slides
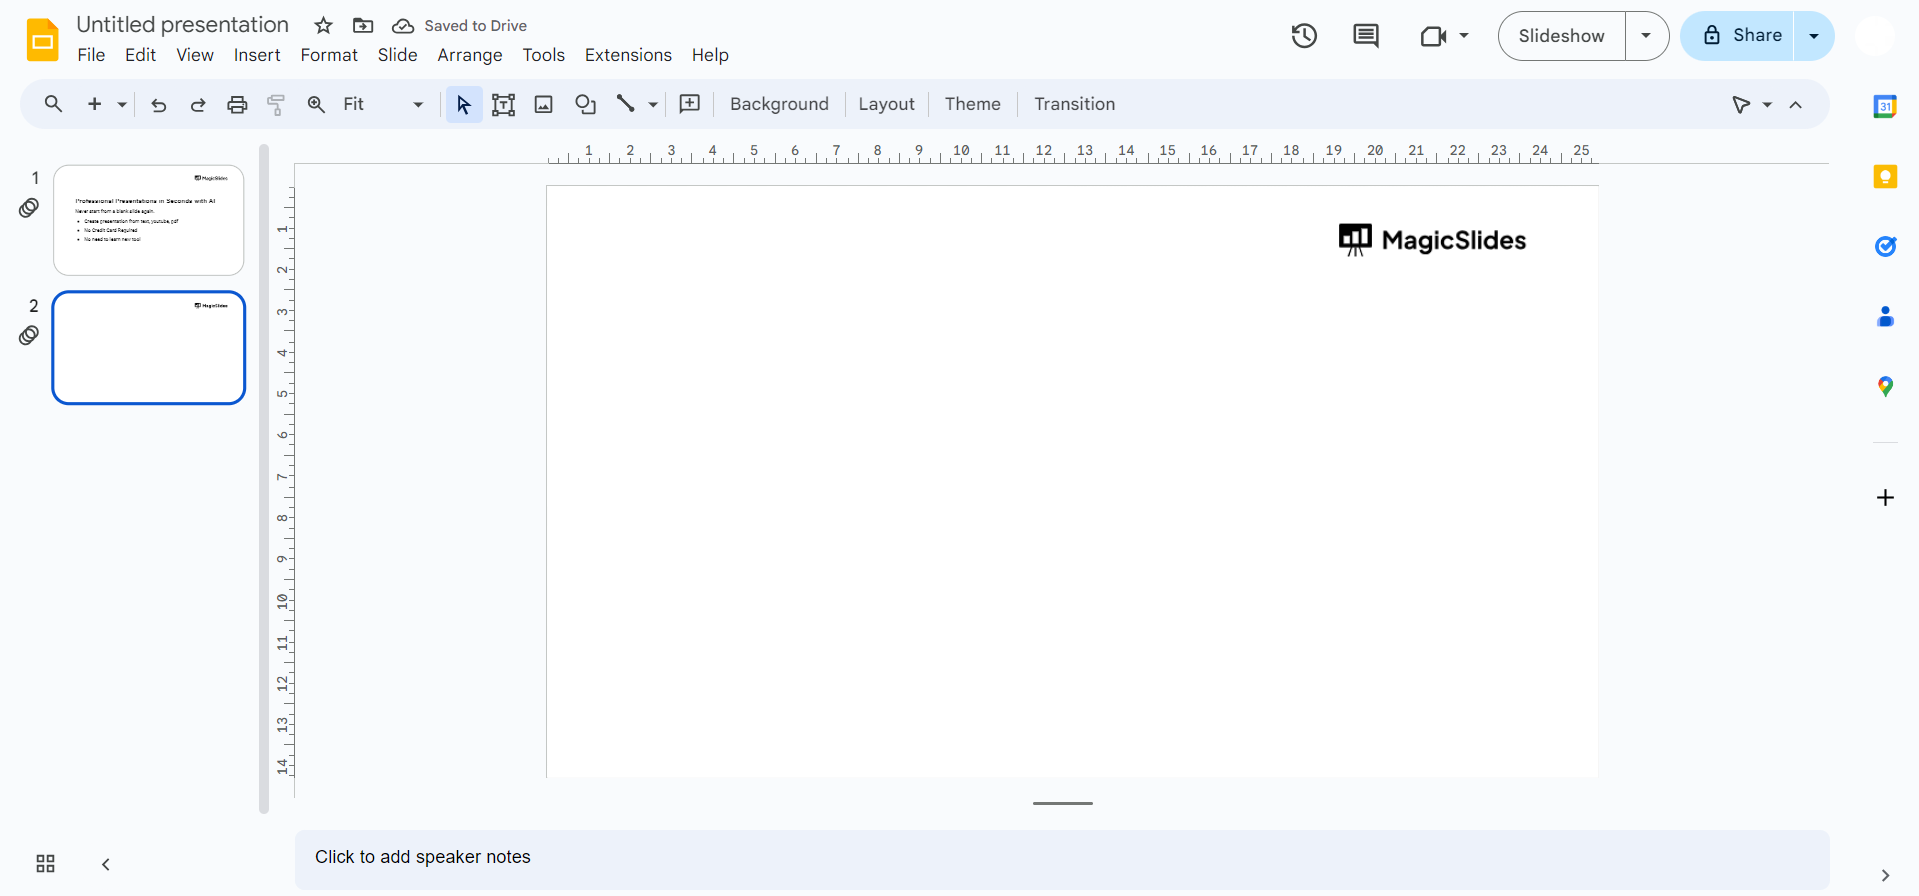
Step 1: Open Your Google Slides Presentation
Begin by opening the Google Slides presentation where you want to add a table. If you haven't created a presentation yet, start a new one and input your content.
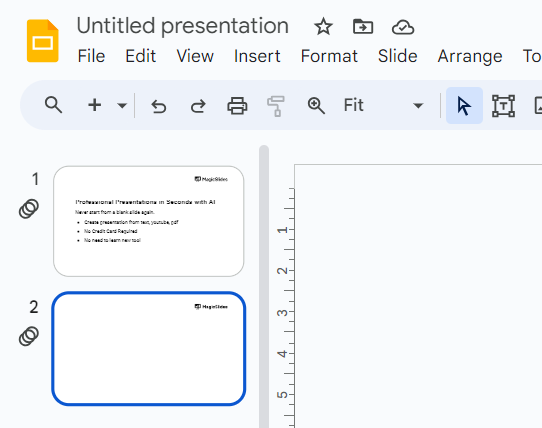
Step 2: Navigate to the Slide Where You Want the Table
Select the specific slide where you'd like to insert the table.
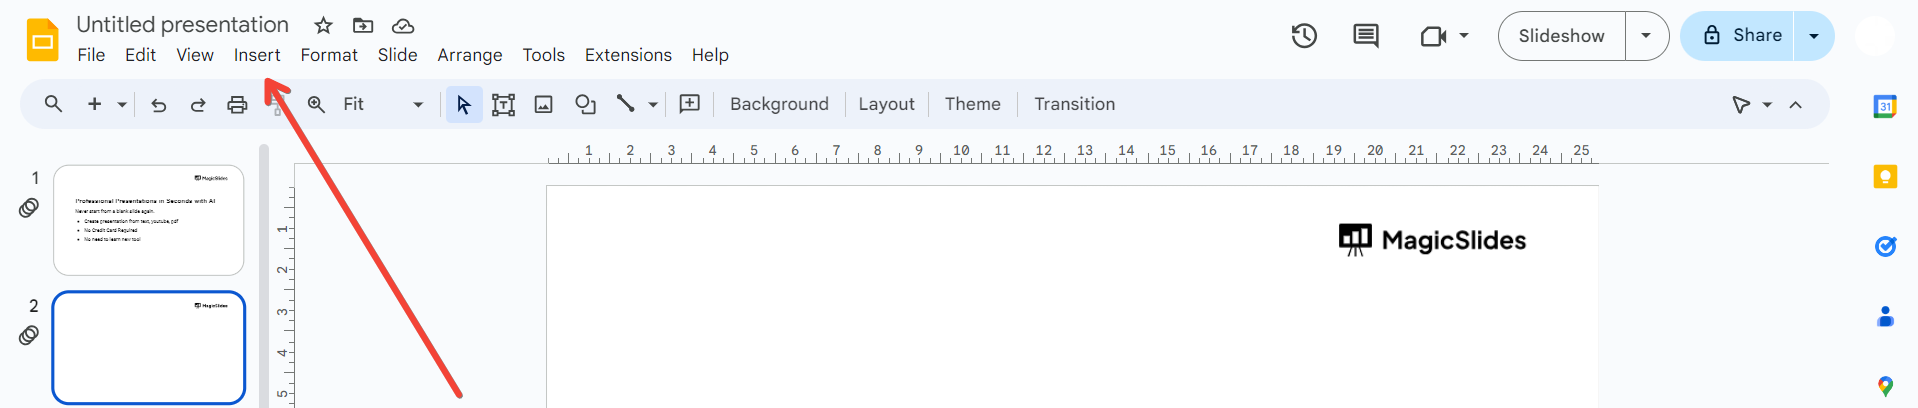
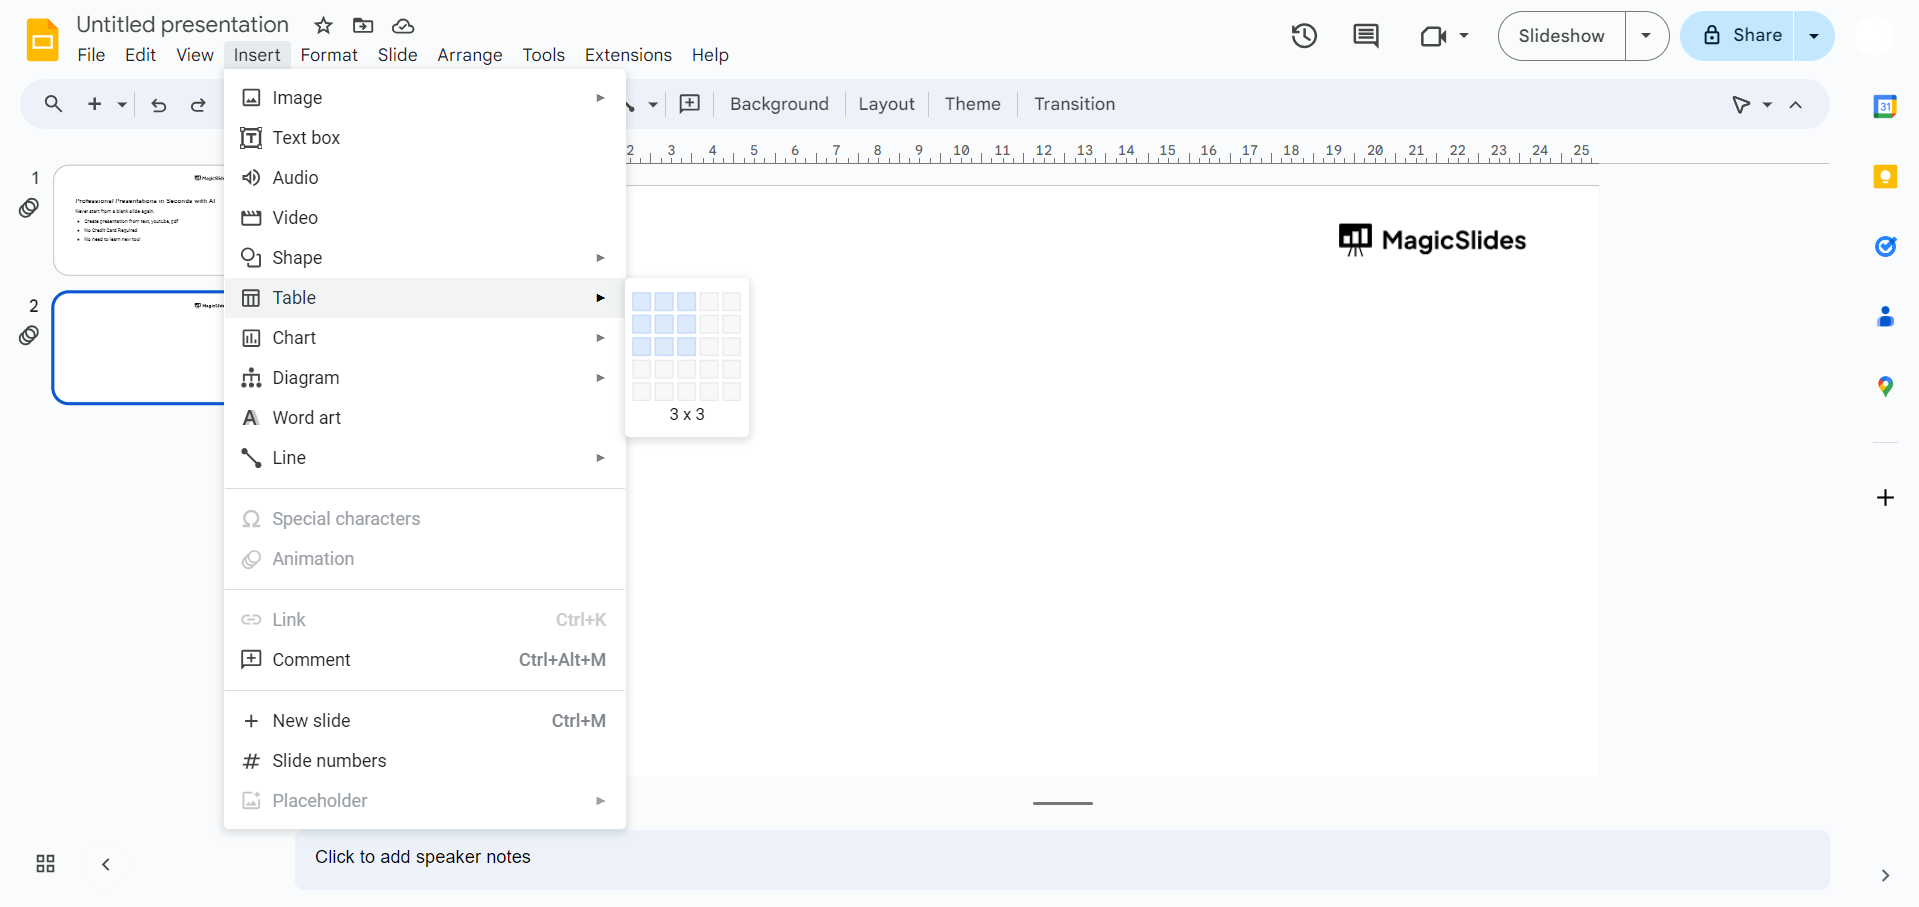
Step 3: Click on the "Insert" Menu
At the top of the screen, click on the "Insert" menu to reveal a dropdown list of options.
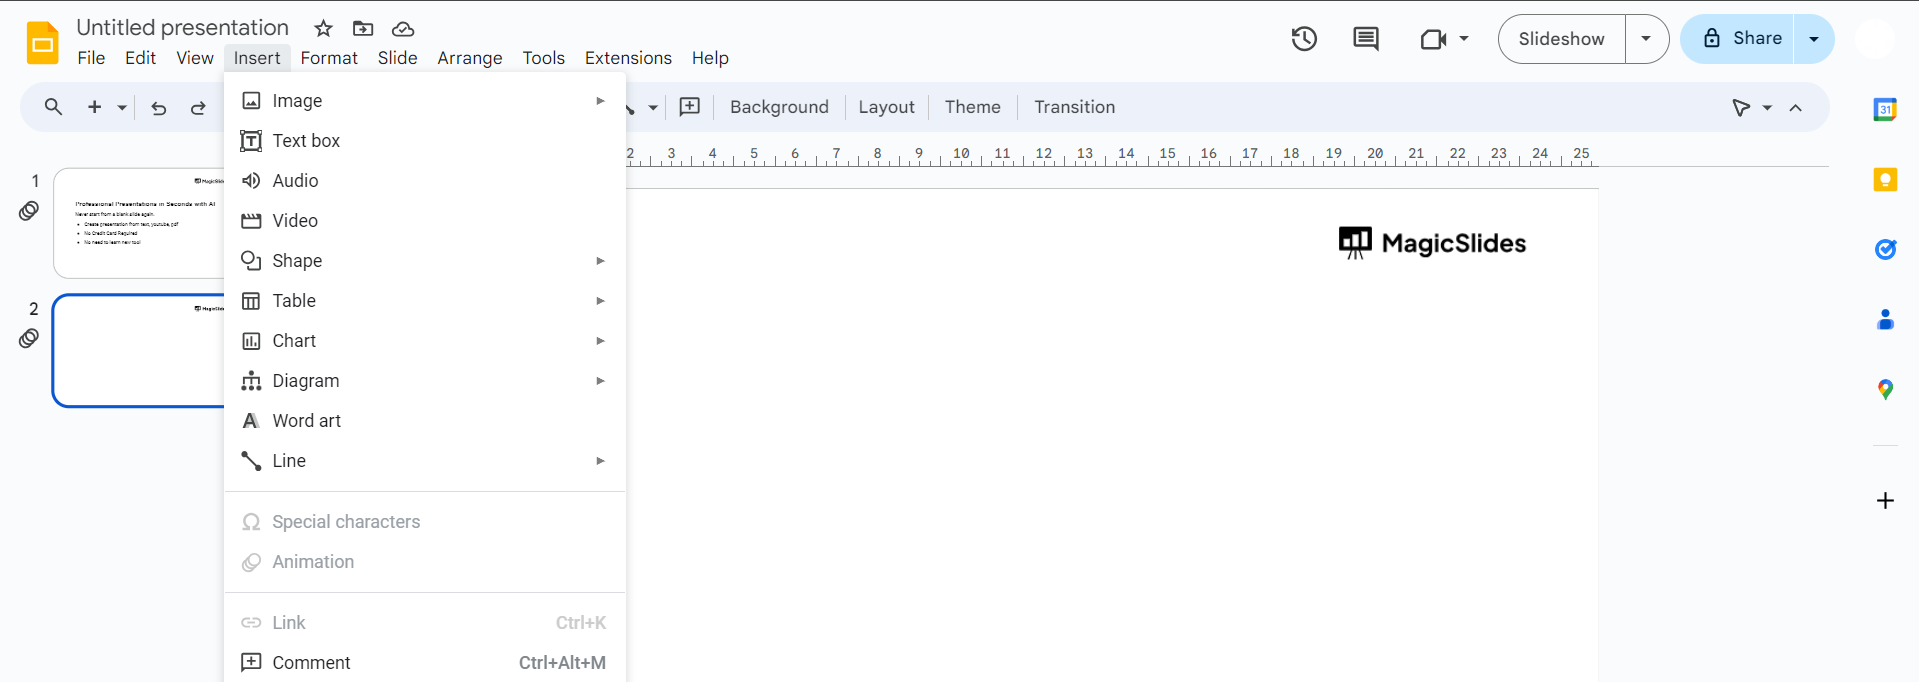
Step 4: Choose "Table"
From the dropdown menu, hover over the "Table" option, and a grid will appear. Drag your cursor over the grid to select the number of rows and columns you desire.
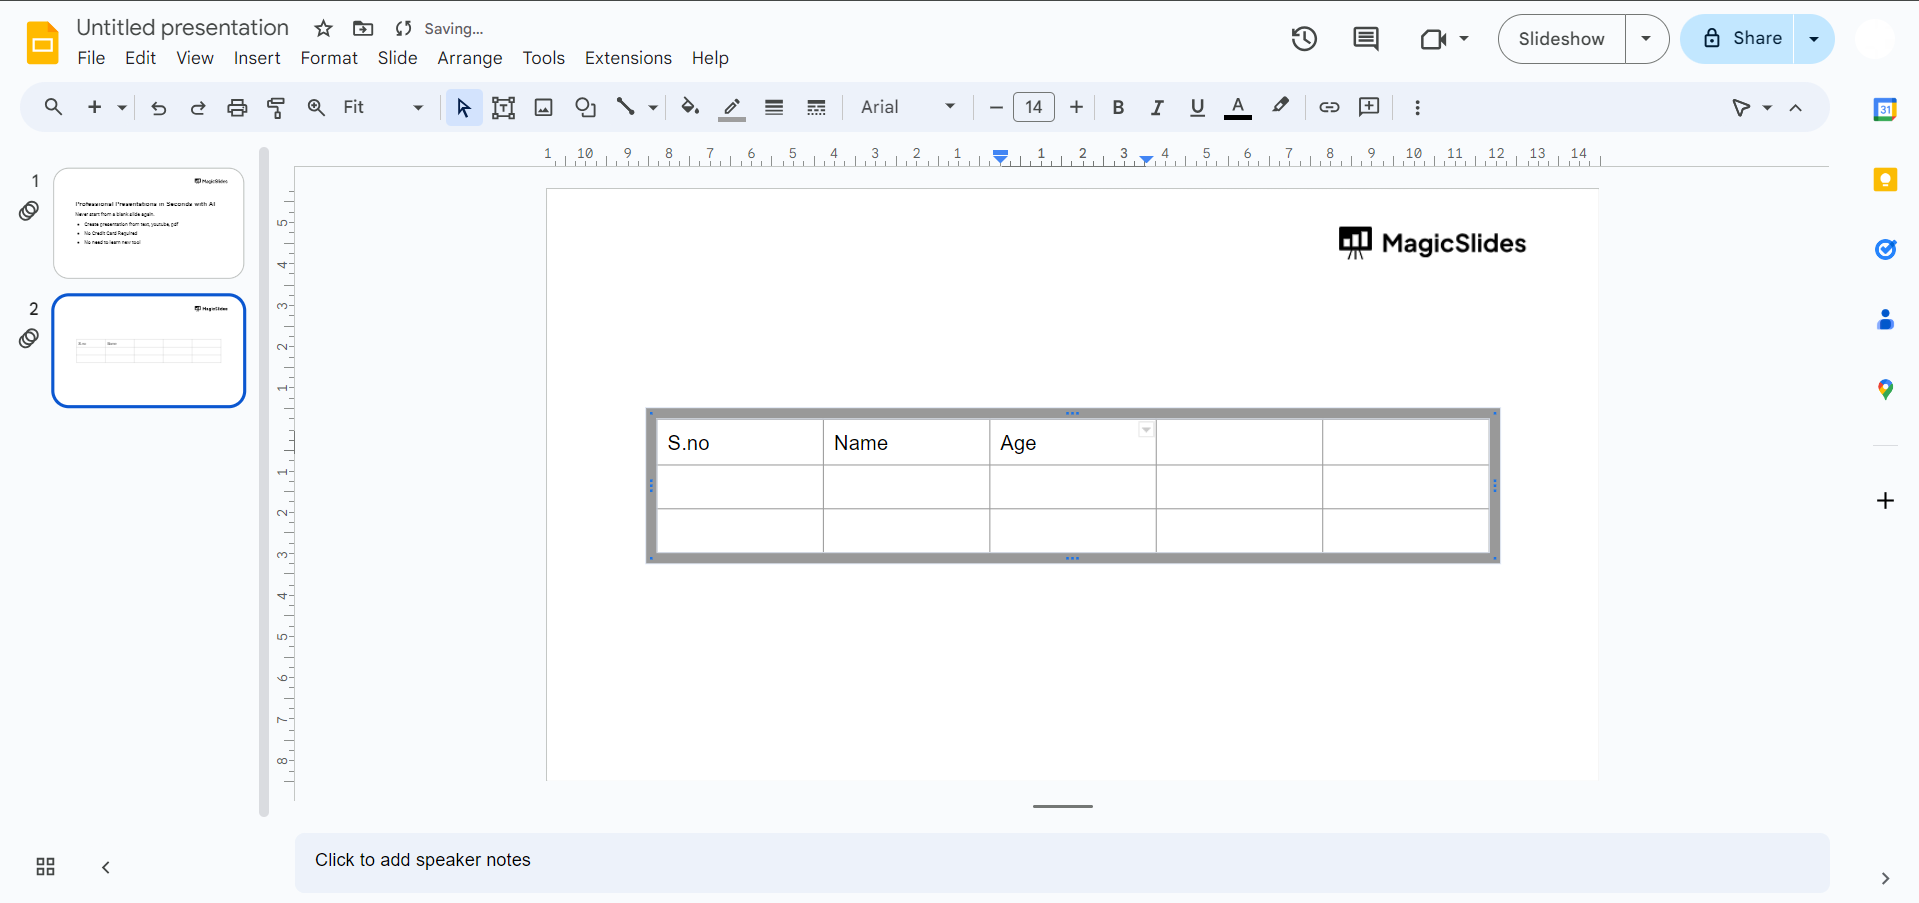
Step 5: Customize Your Table
Once the table is inserted, you can customize it by adjusting the size, adding or removing rows and columns, and changing the background color. Simply click on the table, and options for customization will appear.
Step 6: Input Data
Click on each cell to input your data. You can also copy and paste information from other sources directly into the table.
Step 7: Arrange and Align the Table
Drag the table to the desired location on the slide, and use alignment options to ensure it fits seamlessly into your presentation layout.
Conclusion:
Incorporating tables into your Google Slides presentations can significantly enhance the visual appeal and organization of your content. By following these straightforward steps, you can effortlessly create and customize tables, transforming complex data into clear and digestible information for your audience. Whether you're showcasing statistics, comparisons, or any other form of data, mastering the art of tables in Google Slides will undoubtedly elevate the overall impact of your presentations.
Frequently Asked Questions:
Can I edit the table after it's inserted into Google Slides?
Yes, simply click on the table to access customization options, allowing you to edit size, cells, and content.
Is there a limit to the number of rows and columns in a table?
Google Slides supports a considerable number of rows and columns, but extremely large tables may affect performance.
Can I import data directly into a table from external sources?
Yes, you can copy and paste data from external sources like spreadsheets directly into your Google Slides table.
Is it possible to animate or add transitions to table elements?
Currently, Google Slides doesn't provide built-in animations or transitions specifically for individual table elements.


