Addon google slides iconPPT with AISlide TemplatesPPT TemplatesPricingBlog
    PPT with AISlide TemplatesPPT TemplatesPricingBlog
    Google forms
    1. Home
    2. Blog
    3. How to use analytics in Google forms

    How to use analytics in Google forms

    magicslides app

    Published By

    magicslides app
    Mohit Kumar Jha

    Approved By

    Mohit Kumar Jha

    Published On

    September 21th, 2024

    Reading Time

    2 min read

    Dive into the world of Google Forms analytics with this step-by-step guide for insightful survey analysis.

    Google Forms isn't just a tool for collecting responses; it also offers robust analytics to help you glean meaningful insights.
    Understanding how to use analytics in Google Forms can turn raw data into actionable information.
    In this guide, we'll walk you through each step, unlocking the power of analytics to enhance your survey analysis.

    How to use analytics in Google forms

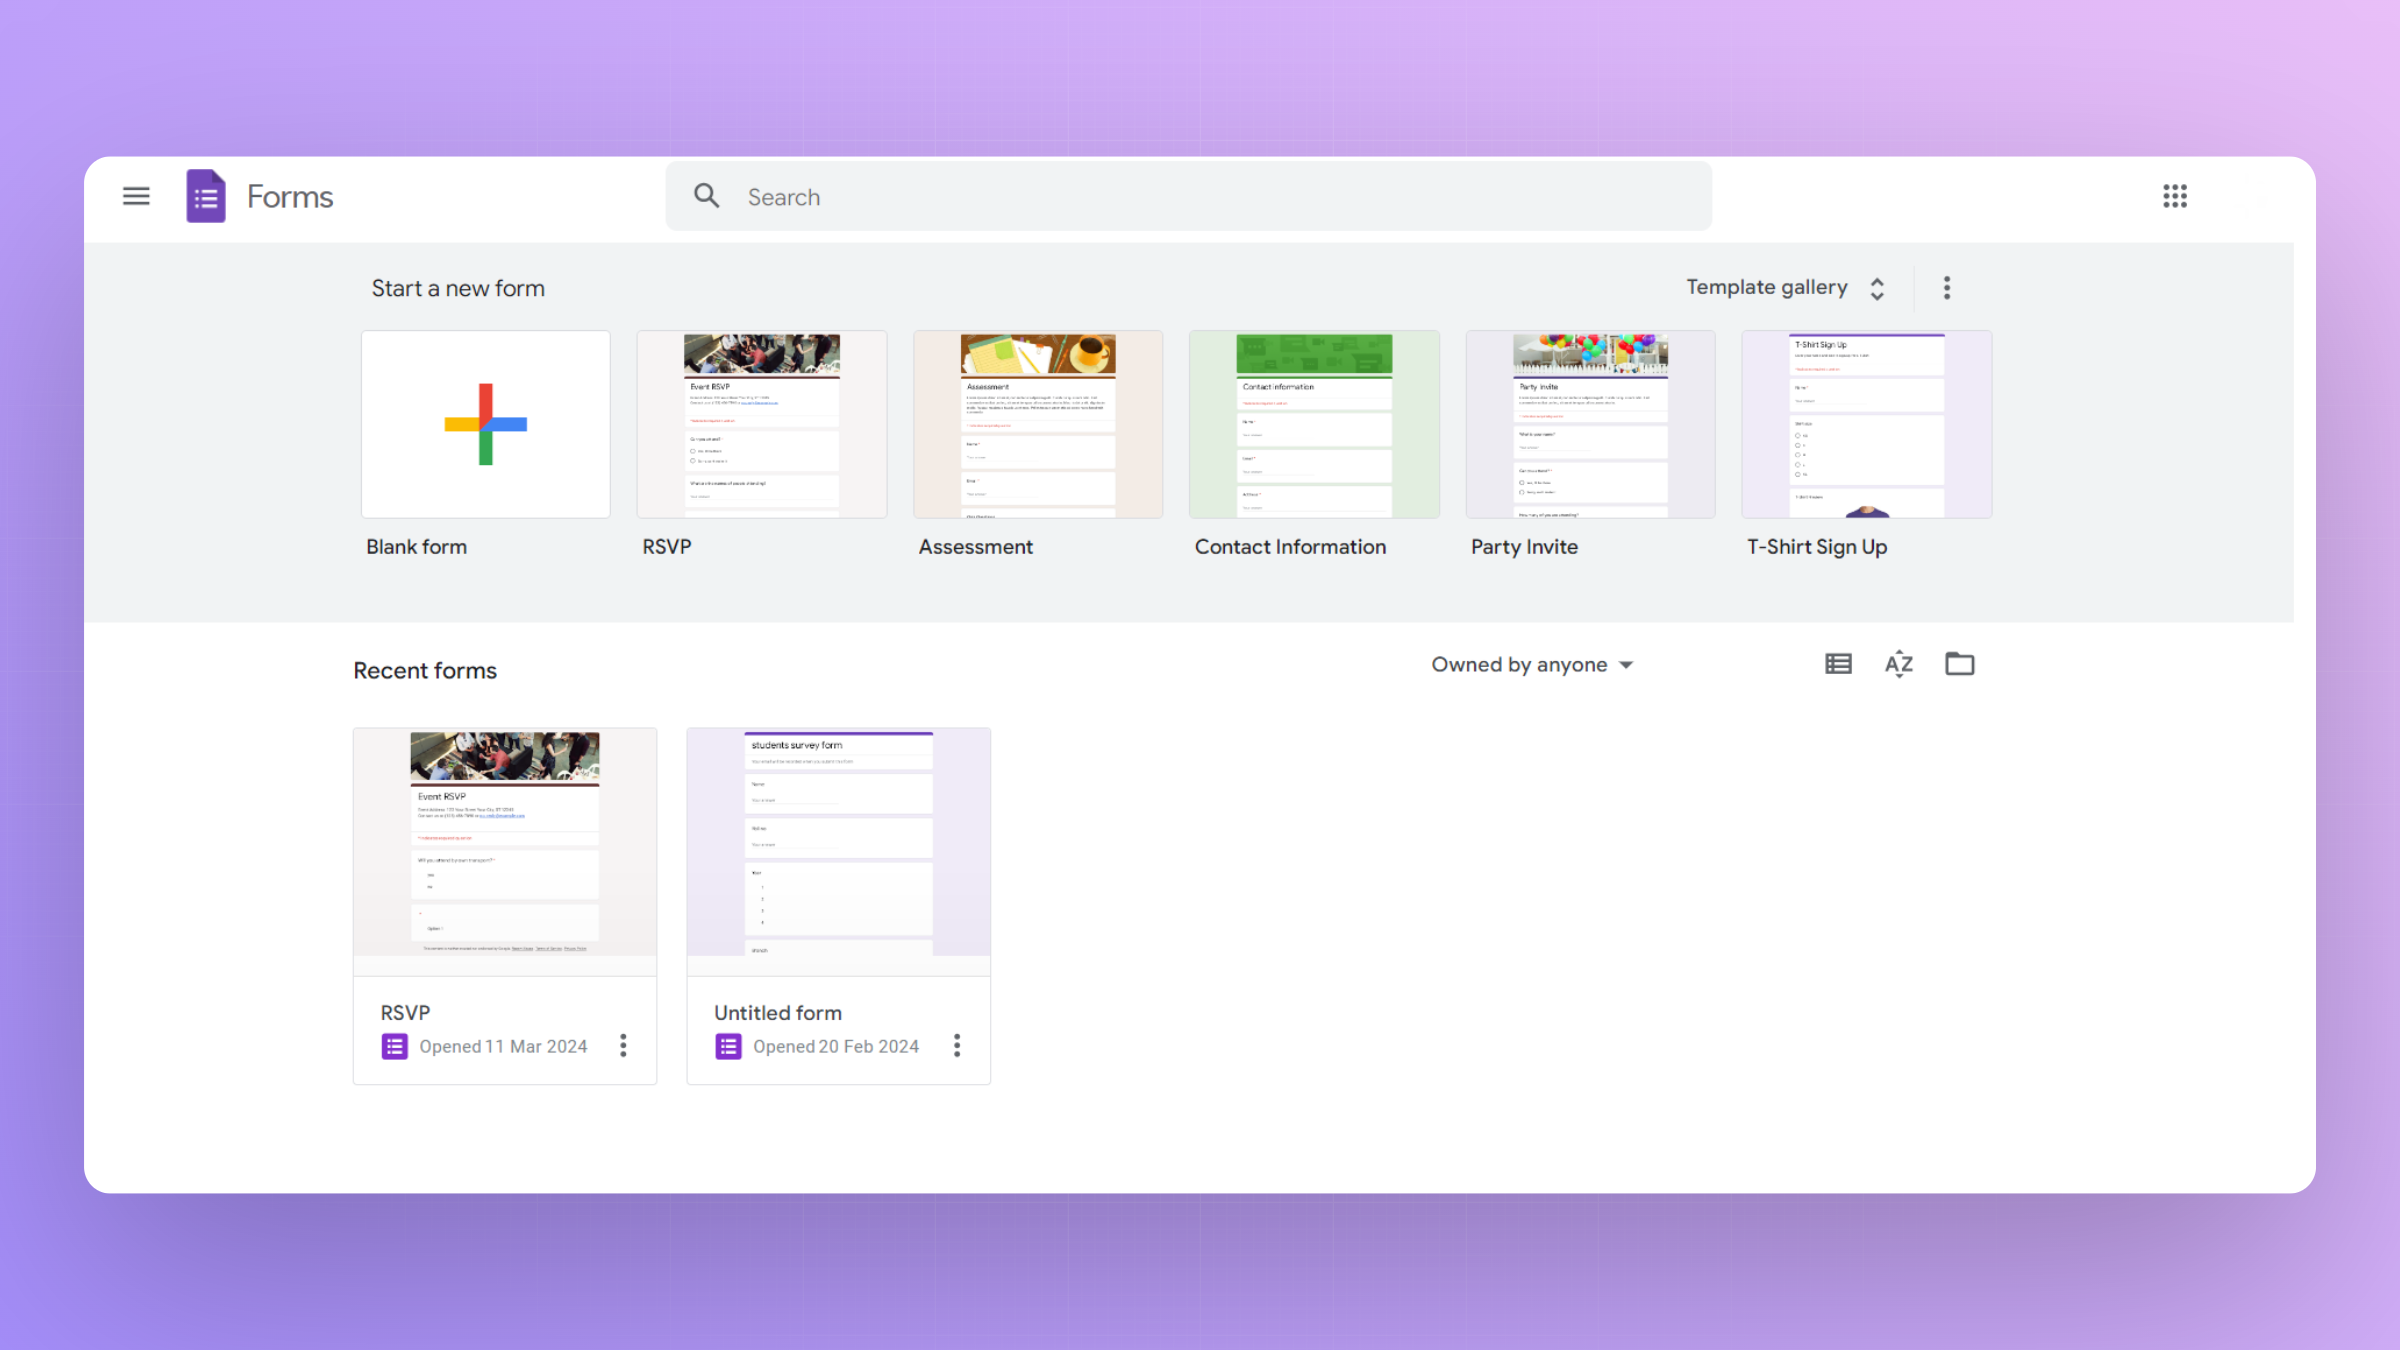
    Step 1: Create or Open a Google Form with Responses

    Begin by creating a new Google Form or accessing an existing one with collected responses.
    If needed, share the form and wait for respondents to submit their answers.
    notion image

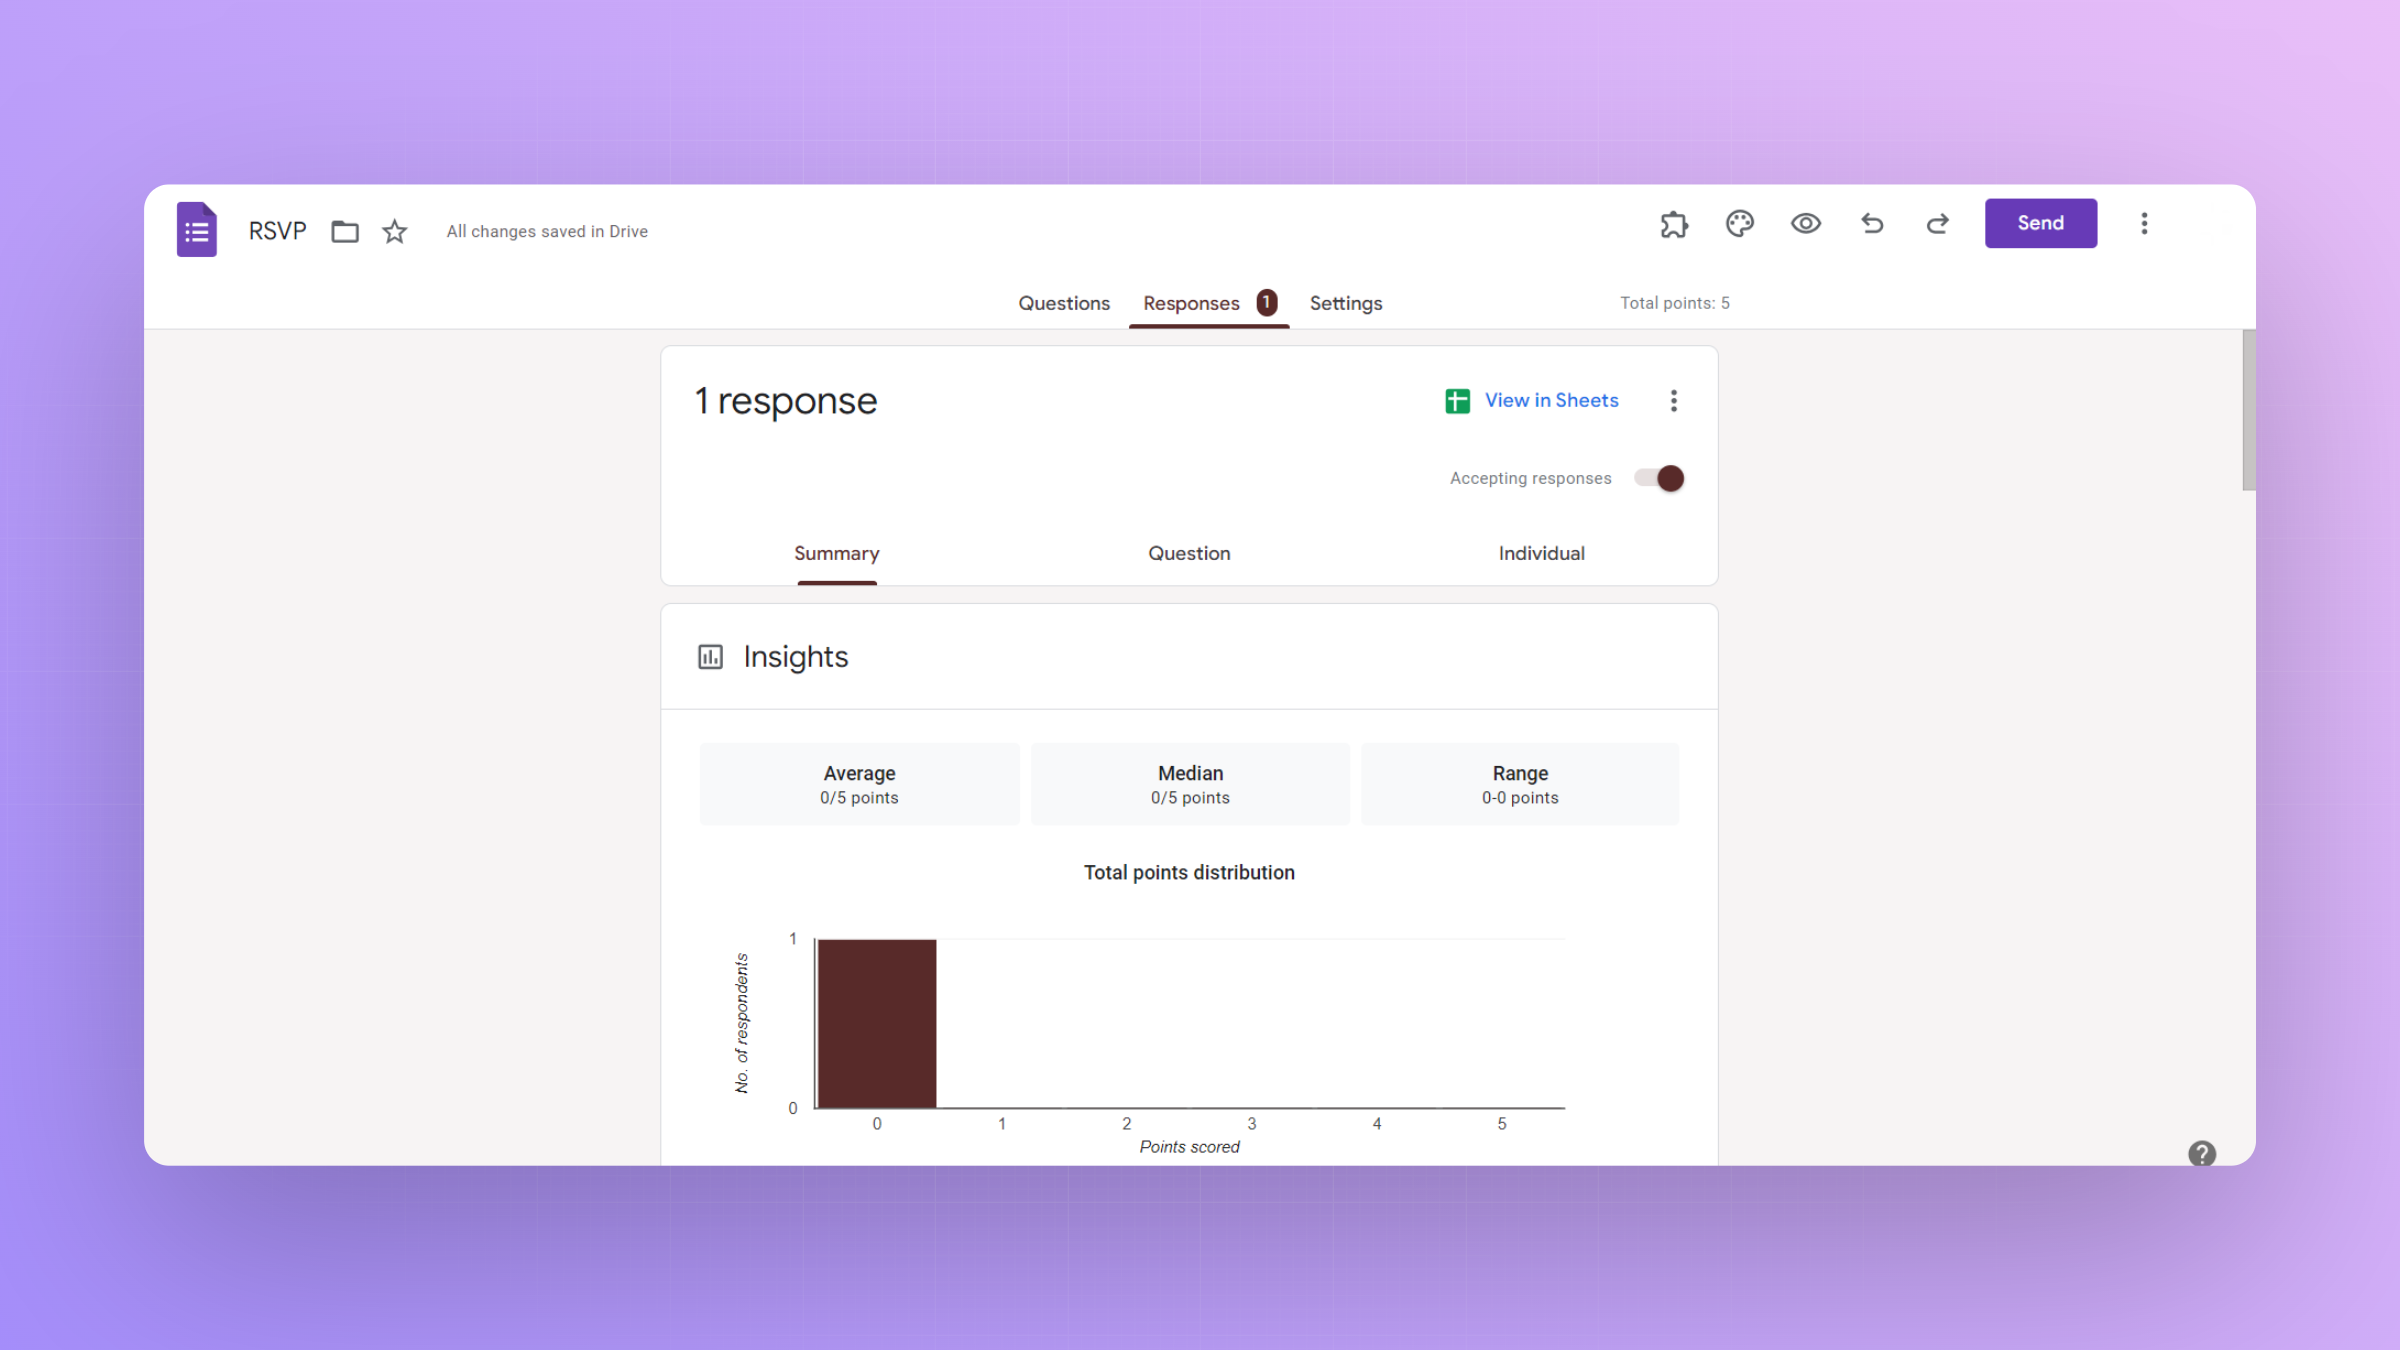
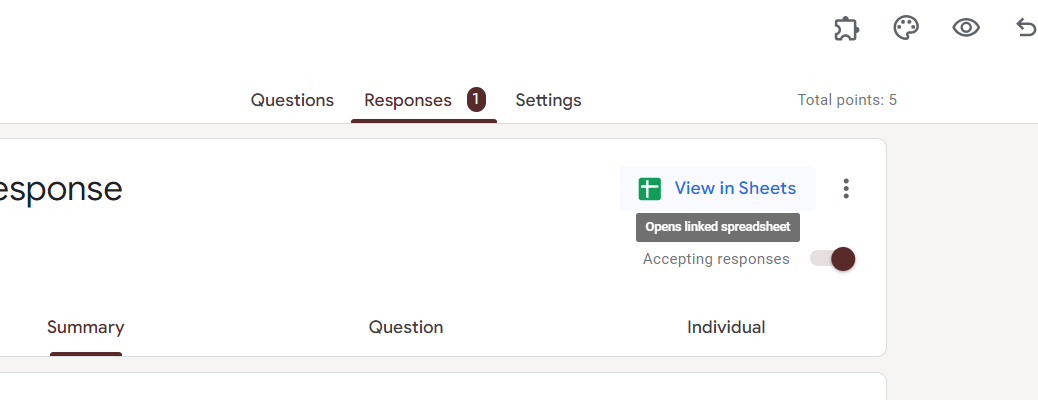
    Step 2: Access the Responses Tab

    Within your form, navigate to the "Responses" tab. Here, you'll find a summary of responses and several options for further analysis.
    notion image

    Step 3: Explore Response Summary

    Take a moment to explore the response summary, which provides an overview of response trends, including charts and graphs for multiple-choice questions.
    notion image

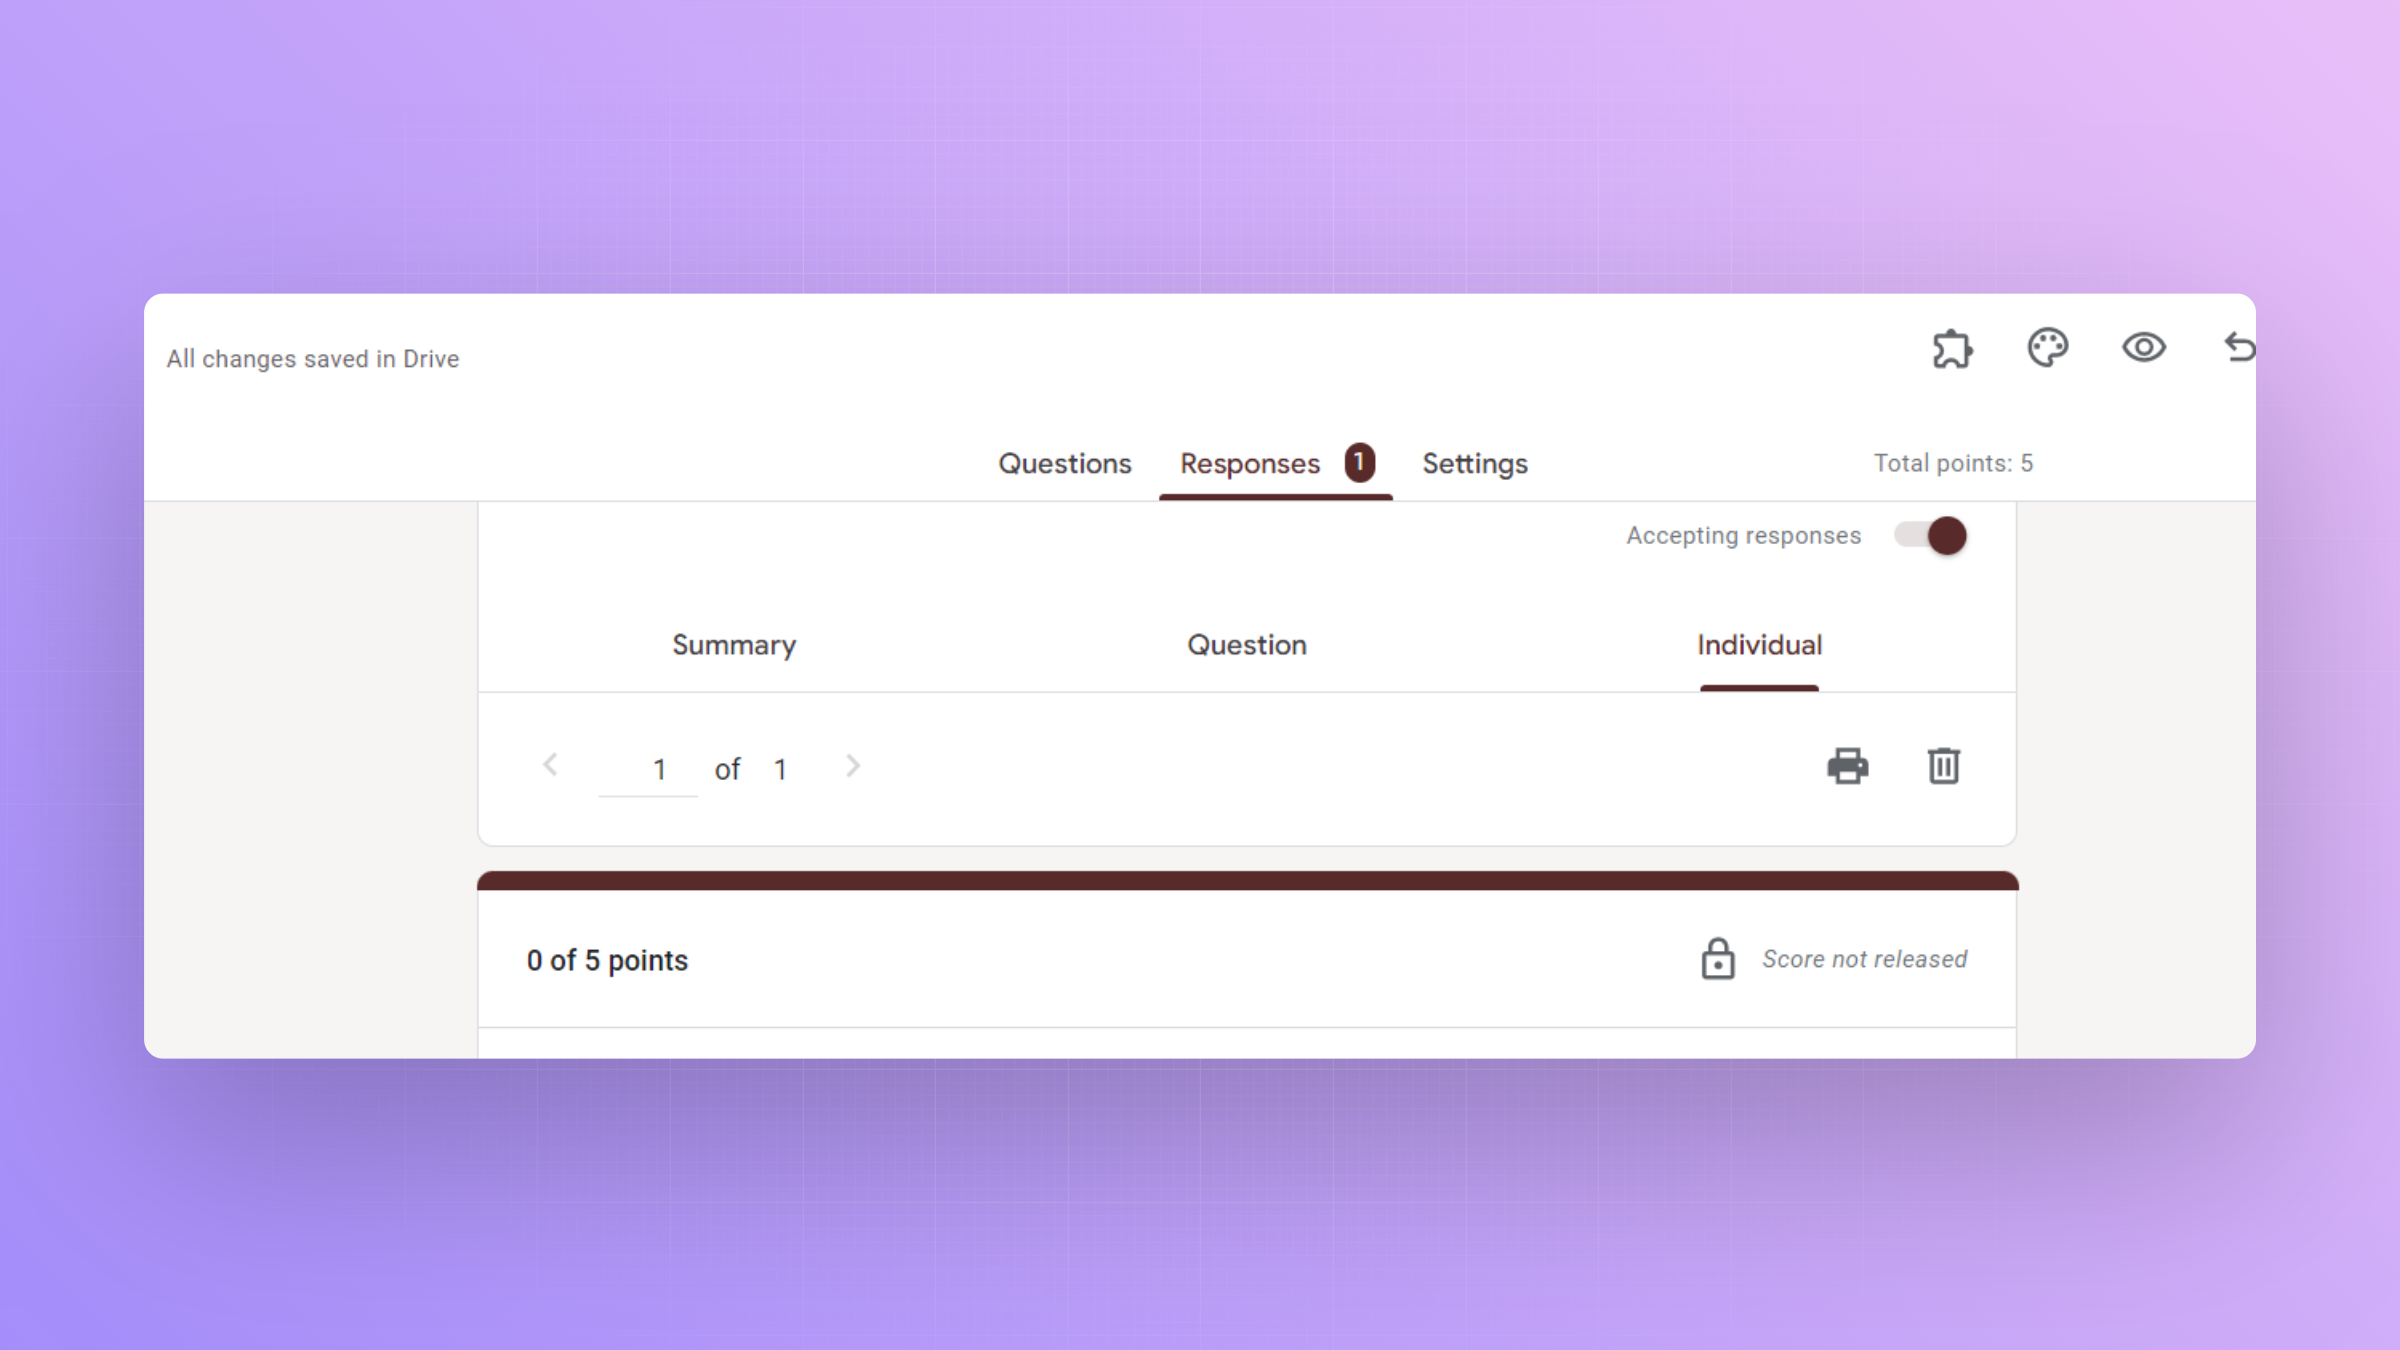
    Step 4: Utilize Individual Responses

    Click on the "Individual" tab to view each respondent's answers.
    This allows for a detailed examination of individual preferences and opinions.
    notion image

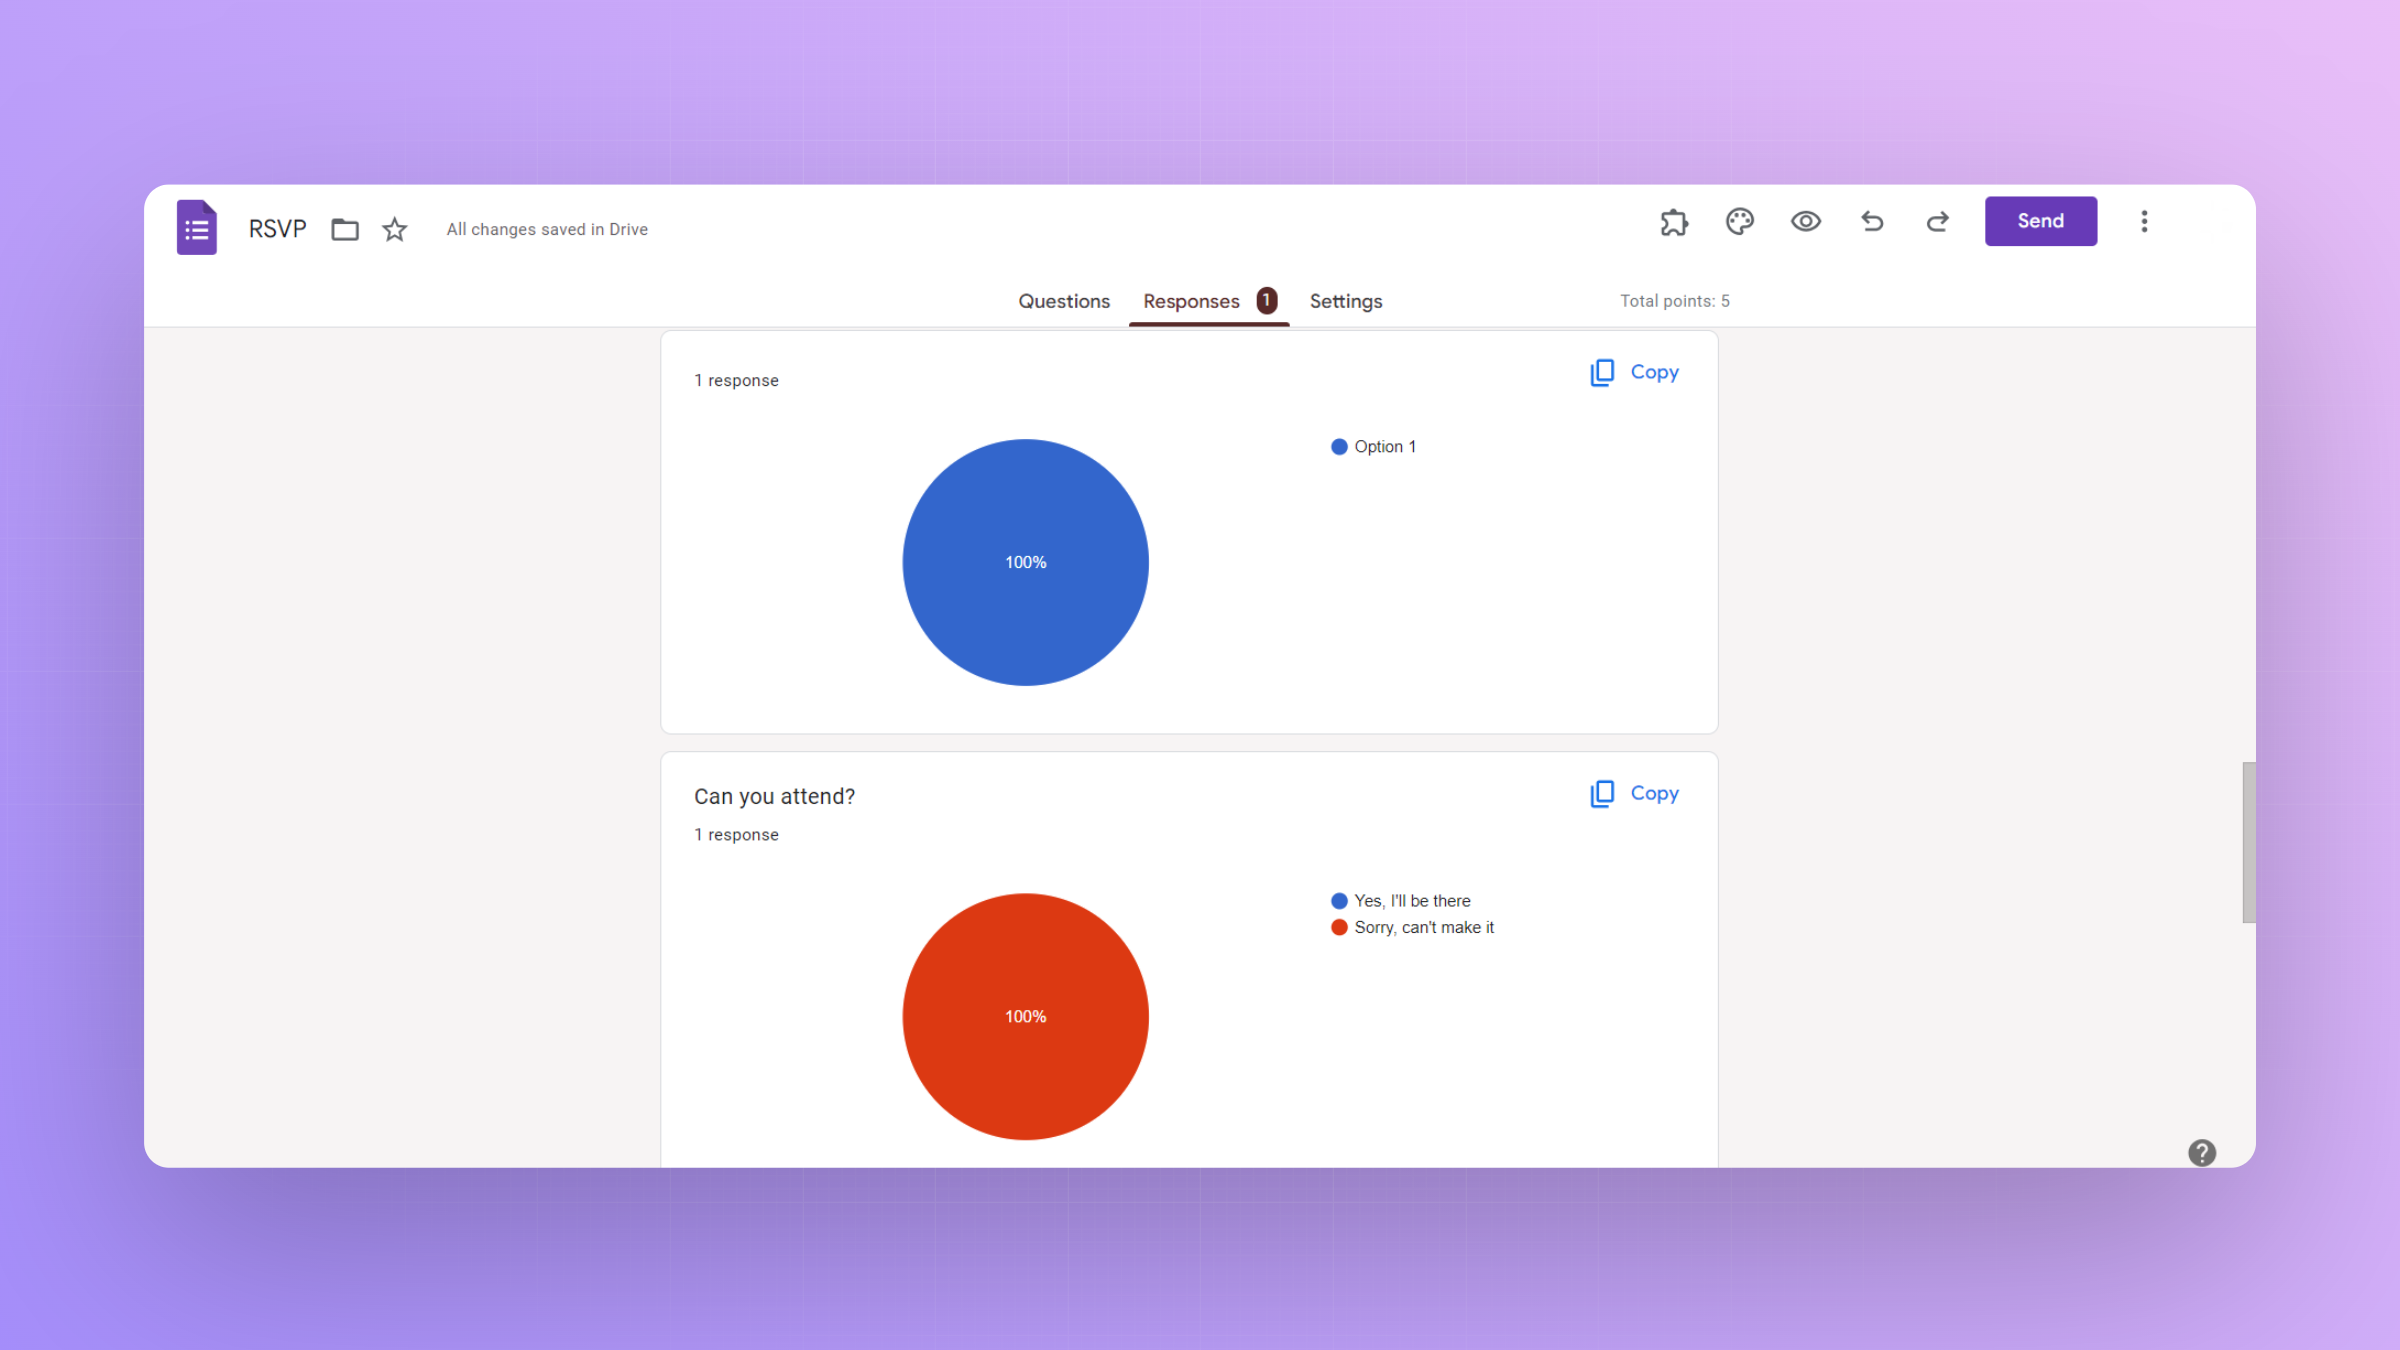
    Step 5: Generate Charts and Graphs

    Create visual representations of your data by clicking on the "Create spreadsheet" icon.
    This opens Google Sheets with your form's responses, enabling more advanced data analysis.
    notion image

    Step 6: Set Up Pivot Tables and Filters (Optional)

    For deeper insights, use Google Sheets to set up pivot tables and filters. These tools help organize and manipulate data for more nuanced analysis.
    notion image

    Conclusion:

    Unlocking the analytics capabilities in Google Forms transforms your survey data into a goldmine of actionable insights.
    By navigating through the responses tab, exploring summaries, and delving into individual responses, you gain a comprehensive understanding of respondent trends Elevate your survey analysis skills by mastering the step-by-step process of using analytics in Google Forms.

    Frequently Asked Questions:

    Can I analyze responses in real-time with Google Forms analytics?

    Yes, Google Forms provides real-time analytics, allowing you to monitor responses and trends as they occur.

    Is it possible to share the analytics reports with others?

    Absolutely! You can share Google Forms analytics reports by providing access to the Google Sheets file.

    Can I export the analytics data for further analysis in external tools?

    Yes, Google Forms seamlessly integrates with Google Sheets, allowing you to export data for external analysis.

    Share on socials

    About the author

    Sanskar Tiwari profile photo
    Sanskar Tiwari— Founder at MagicSlides

    Sanskar is Founder at IAG Tech, For the past 3 years sanskar have build more than 24+ products, taught 100k students how to code.

    More from Sanskar

    More from the blog

      250+ Good Morning Messages for Her (Romantic, Deep, Cute & Sweet)

      30 January 2026

      200+ Heart Touching Birthday Wishes for Sister (Short, Funny and More)

      29 January 2026

      50+ History Presentation Topics For 2026

      28 January 2026

      How to Add Music to Your Canva Presentation: A Step-by-Step Guide

      27 January 2026

      15 Quick Tips To Use ChatGpt At Work

      22 January 2026

      11 Best AI Tools for Business in 2025

      22 January 2026

      How to Create an Infographic That Clearly Communicates Your Message

      20 January 2026

      How to Create a Sales Presentation Template in Google Sheets

      20 January 2026

      How to Make a Pie Chart on Google Slides in Simple Steps

      19 January 2026

    Table of Contents

    Create Presentations in Seconds

    Transform your ideas into professional presentations with AI. No design skills needed.

    Try MagicSlides Free

    Create Stunning Presentations with AI in Seconds ✨

    Transform any topic, text, YouTube video, PDF or URL into beautiful presentations instantly with MagicSlides AI.

    Try MagicSlides AI Presentation Maker
    MagicSlides AI Presentation

    Footer

    Solutions

    • MagicSlides App
    • Google Slides Add-on
    • MagicSlides in Chrome
    • MagicSlides in Figma
    • MagicSlides in ChatGPT
    • MagicSlides in Telegram
    • MagicSlides in Zapier
    • MagicSlides in Figma Slides

    Tools

    • AI PPT Tools
    • QR Code Generator
    • Design Tools
    • PPT Templates
    • Slide Templates
    • PDF Tools

    Examples

    • AI Presentations
    • PPT by MagicSlides
    • Quizzes
    • Charts
    • Coloring Pages

    Resources

    • Changelog
    • Documentation
    • API Docs

    Top Blogs

    • How to Create Presentation Using ChatGPT
    • 100+ Best Seminar Topics for Students in 2025

    Company

    • Help
    • MCP
    • Blog
    • Pricing
    • Affiliate Program
    • Manage Subscription
    • Privacy Policy
    • Contact Us
    • Terms & Conditions
    • Refund & Cancellation Policy

    We also built

    • SheetAI - GPT For Sheets
    • MagicForm - GPT For Google Forms
    • SecondBrain.fyi
    • BlogBee - Free Blogging Platform

    © 2026 IndianAppGuy Tech Pvt Ltd. All rights reserved.