How to create charts with just a prompt


Elevate data interpretation, effortlessly convert text into impactful charts with MagicSlides.app’s intuitive chart converter tool!
Unlock the power of visual data representation with MagicSlides.app. In this article, we'll guide you through a user-friendly process using the AI PPT Tool, specifically designed for transforming textual information into insightful charts.
How to create charts with just a prompt
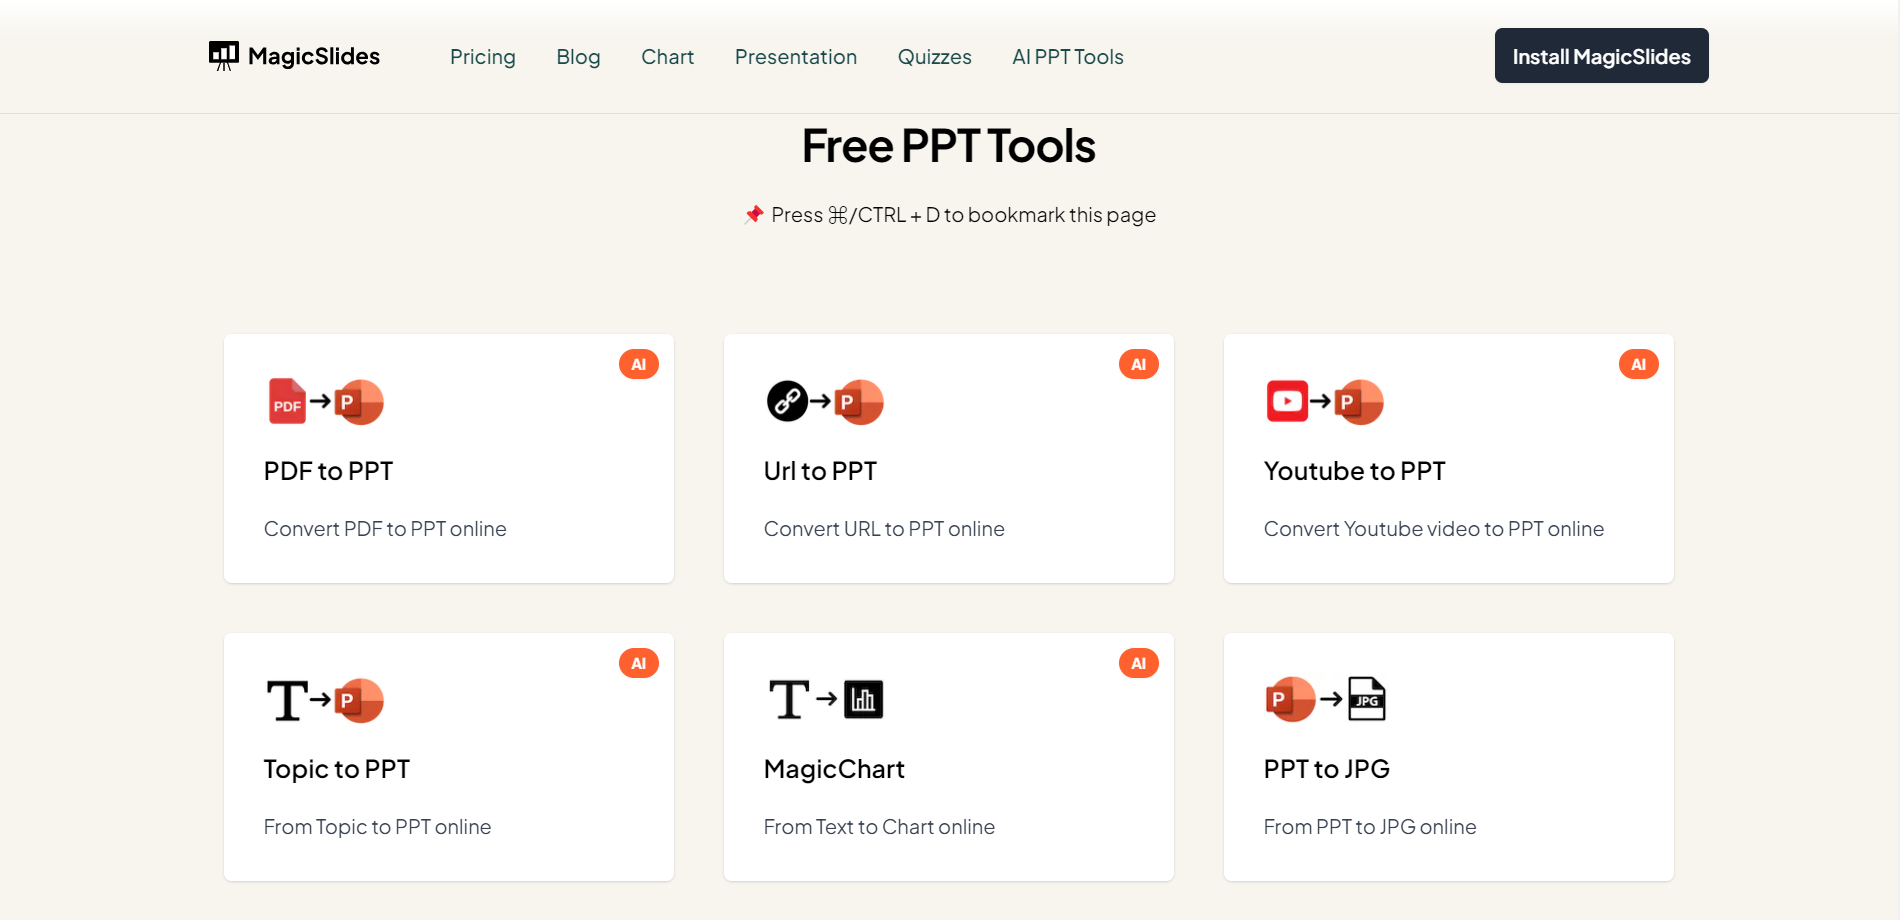
Step 1: Navigate to MagicSlides.app
Commence by visiting https://www.magicslides.app/tools. Select the AI PPT Tool text into charts, which lays the groundwork for effortless chart creation.
Step 2: Input Your Text and Prompt
Once on the platform, enter your textual data into the first blank field. Add a prompt to guide the tool in understanding your data. This step ensures accuracy in chart generation.
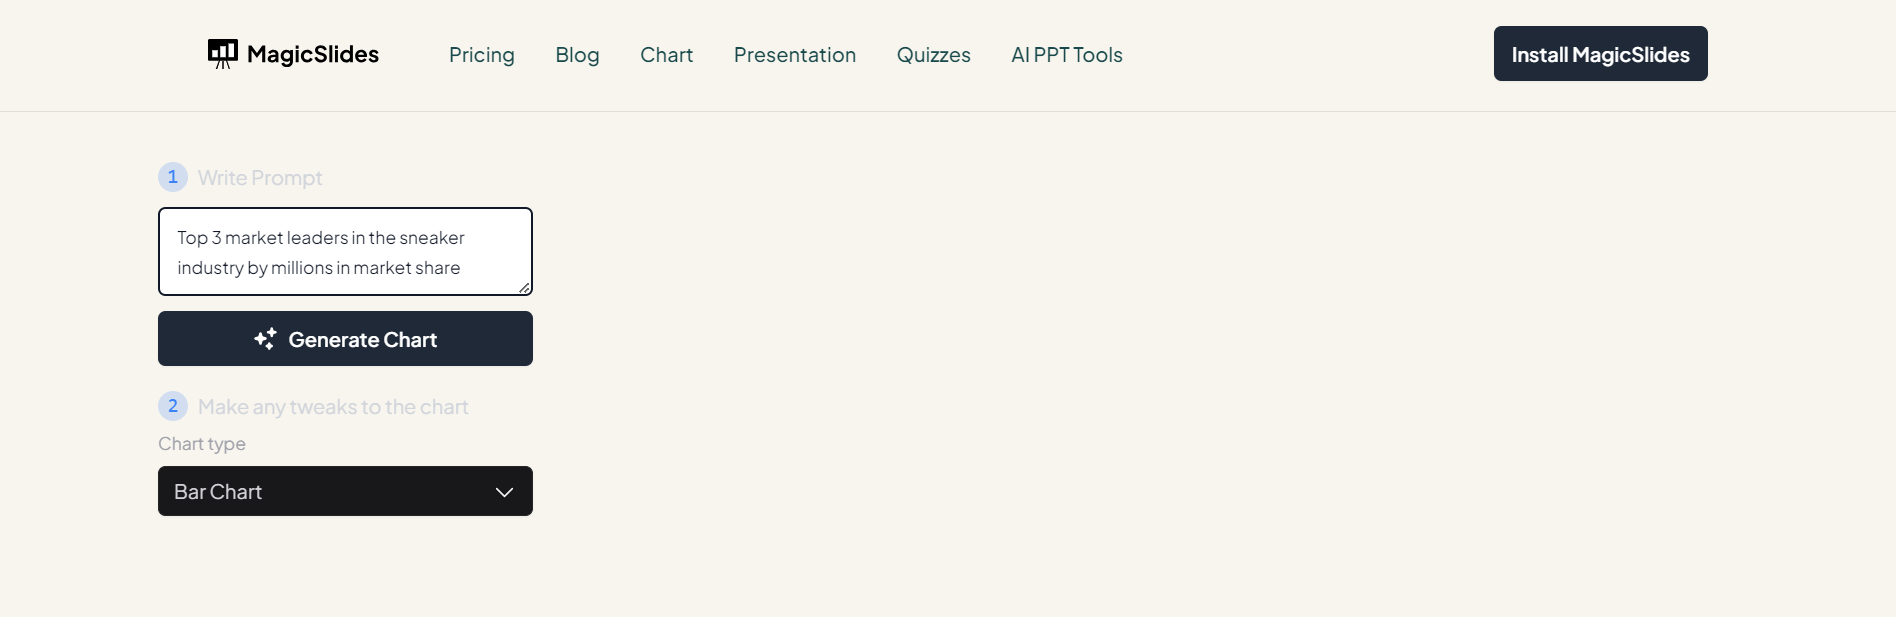
Step 3: Choose Your Chart Type
In the second input field, select your preferred chart type. Whether it's a bar chart, pie chart, or any other, MagicSlides.app offers versatility to cater to your specific data visualization needs.
Step 4: Click "Generate Chart"
Initiate the chart creation process by clicking the "Generate Chart" button. MagicSlides.app's intelligent algorithms will analyze your input and transform it into a visually engaging chart.

Step 5: Your Chart is Ready for Analysis
Upon completion, your chart is ready for analysis. Dive into the insights presented by the visually appealing representation of your textual data, making complex information more accessible and understandable. Once you are satisfied with response click on download chart for further data analysis.

Conclusion:
MagicSlides.app streamlines the process of creating charts from text, offering a powerful tool for data visualization. By following these five straightforward steps, you can transform raw information into insightful visualizations. Embrace the efficiency of online tools and elevate your data analysis game effortlessly!
Frequently Asked Questions
Q: Can I create charts from any type of text using MagicSlides.app?
A: Yes, MagicSlides.app is designed to convert various types of textual data into insightful charts.
Q: Is there a limit to the complexity or length of the text for accurate chart generation?
A: While MagicSlides.app is versatile, extremely lengthy or complex text may impact processing time. Optimal results are achieved with concise and well-structured data.
Q: Do I need to specify the chart type, or can MagicSlides.app suggest one automatically?
A: You have the flexibility to choose your desired chart type from options like bar charts or pie charts, ensuring customization based on your data representation needs.


