How to add a Venn Diagram in Google Slides in few clicks


Venn diagrams in Google Slides illustrate relationships, overlaps, and distinctions between data sets, enhancing clarity
To create a Venn diagram in Google Slides, you can use shapes and customize them to represent the overlapping areas. Here are the steps:
Step 1: Open Your Google Slides Presentation:
- Head over to slides.google.com, either open an existing presentataion or create one.
Step 2: Insert a Circle Shape:
- Click on the slide where you want to add the Venn diagram.
- Go to the "Insert" menu at the top and select "Shapes."
- Choose the "Circle" shape from the list. Your cursor will turn into a crosshair.
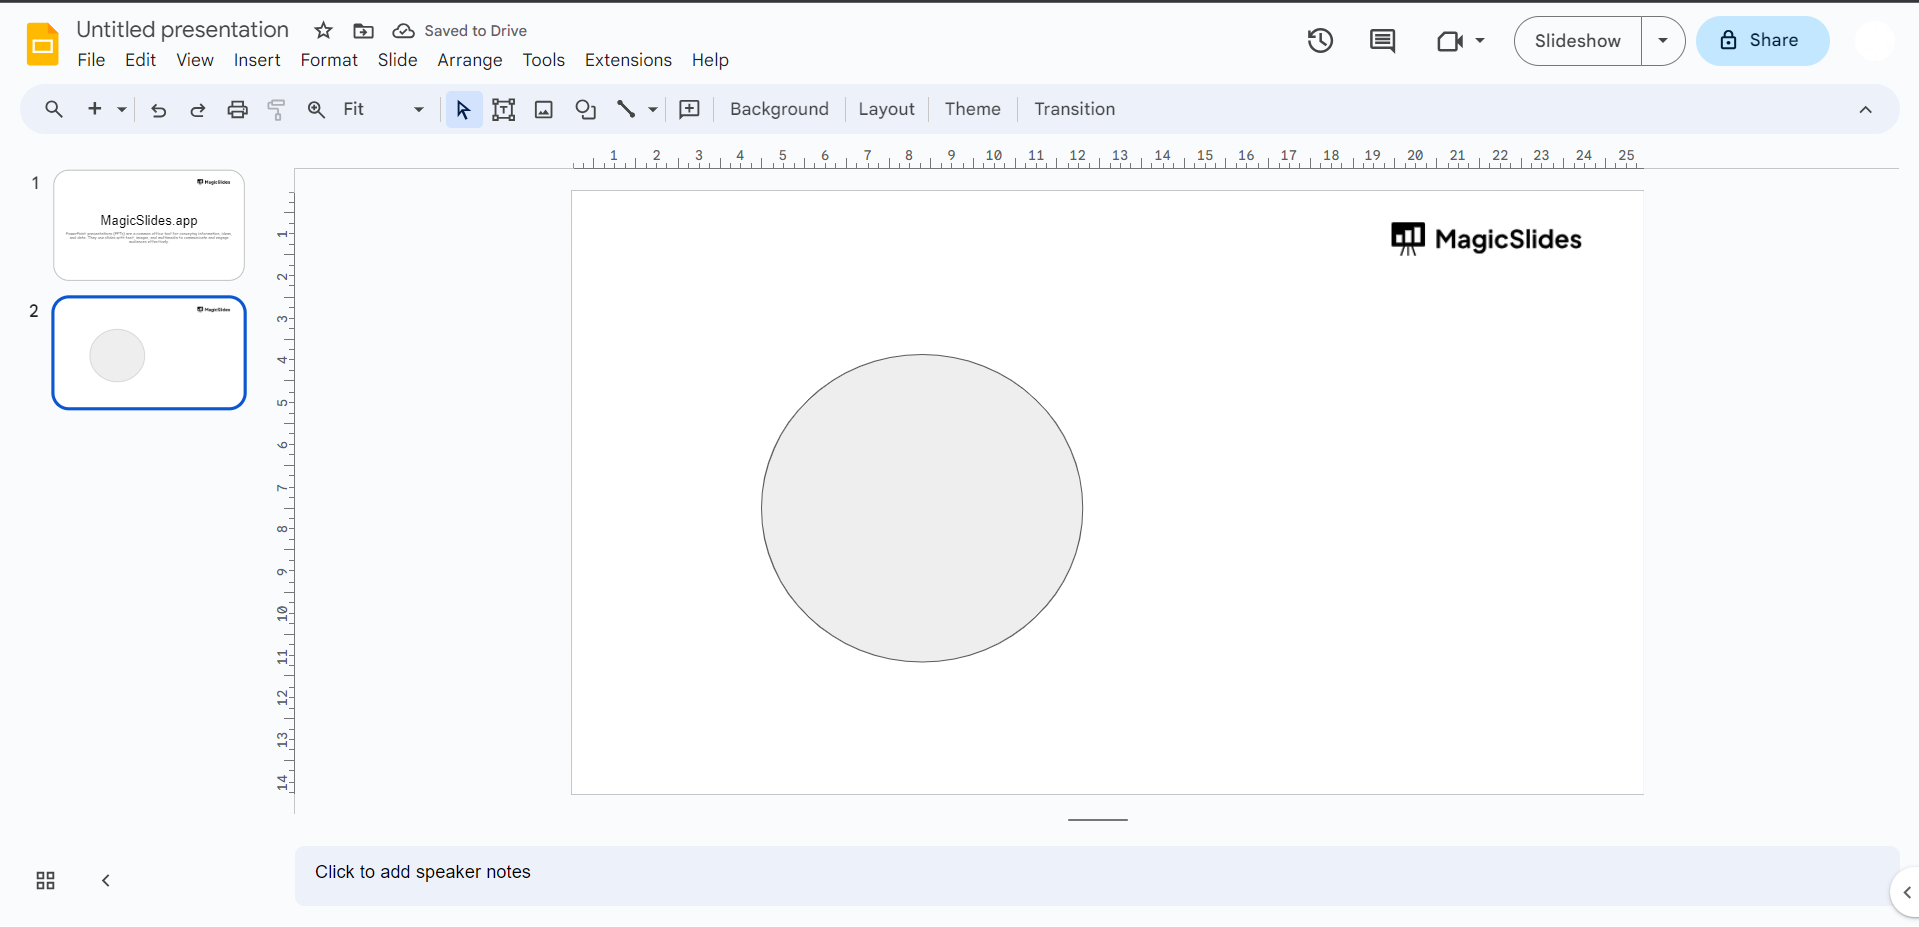
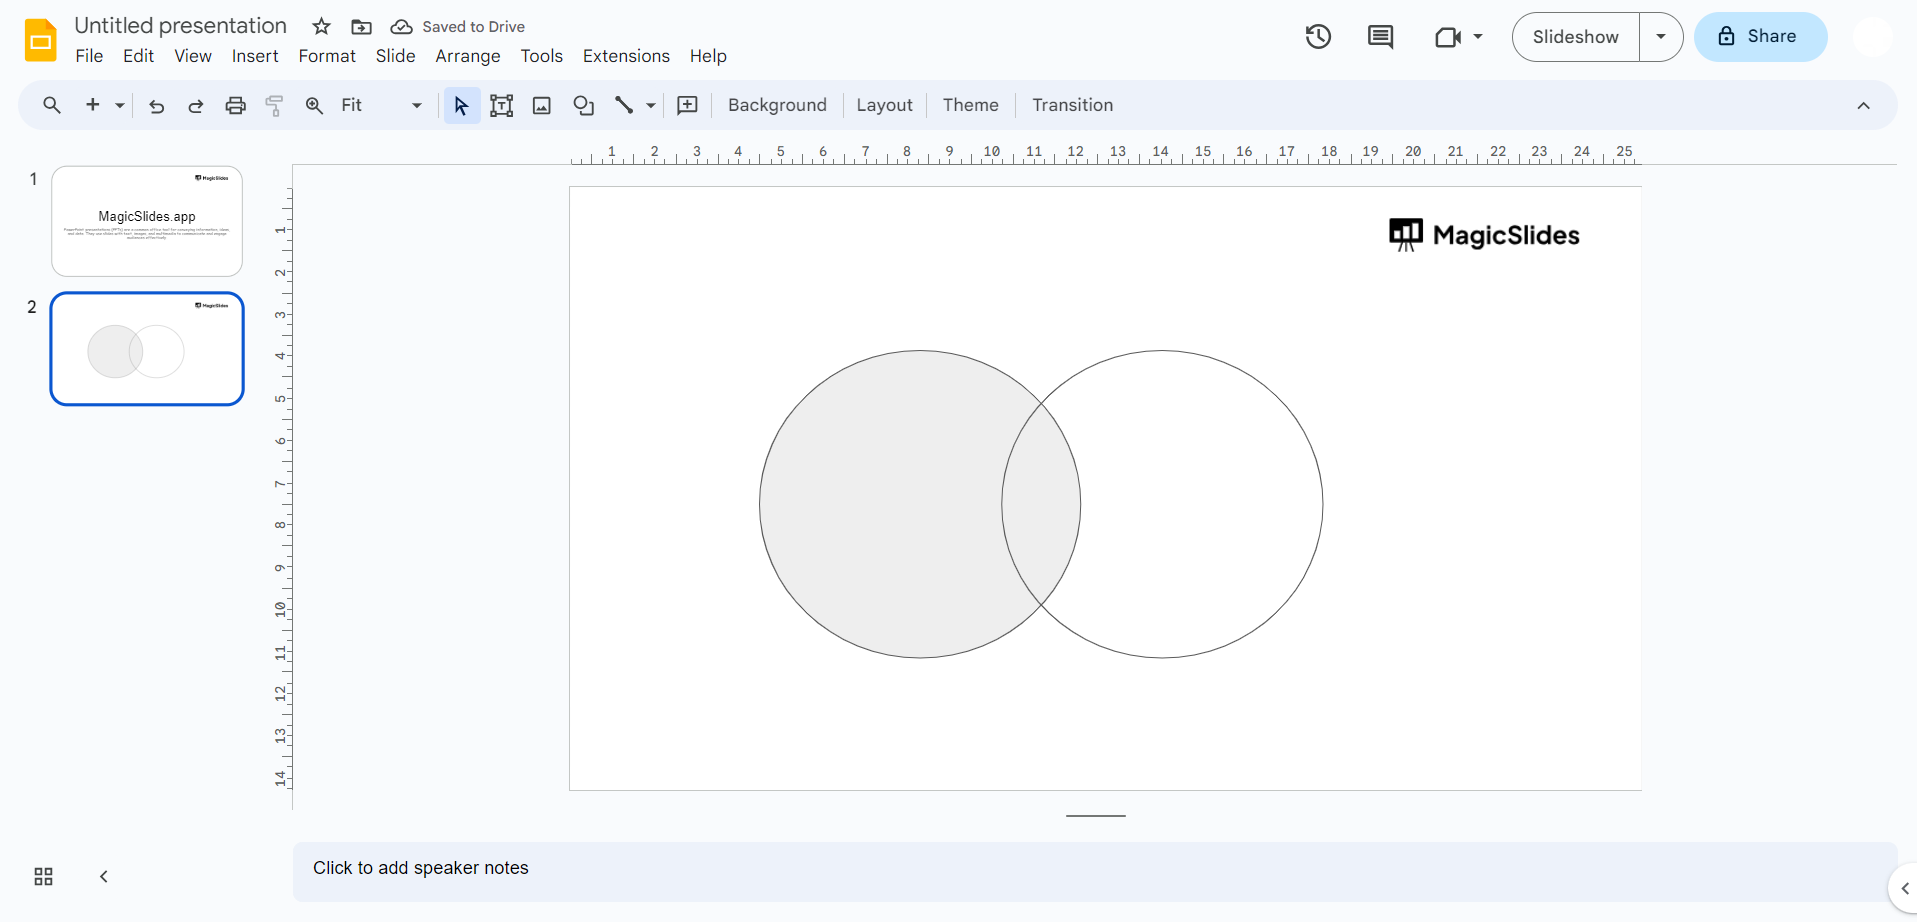
Step 3: Draw the First Circle:
- Click and drag on the slide to draw the first circle. This will represent one set of data.
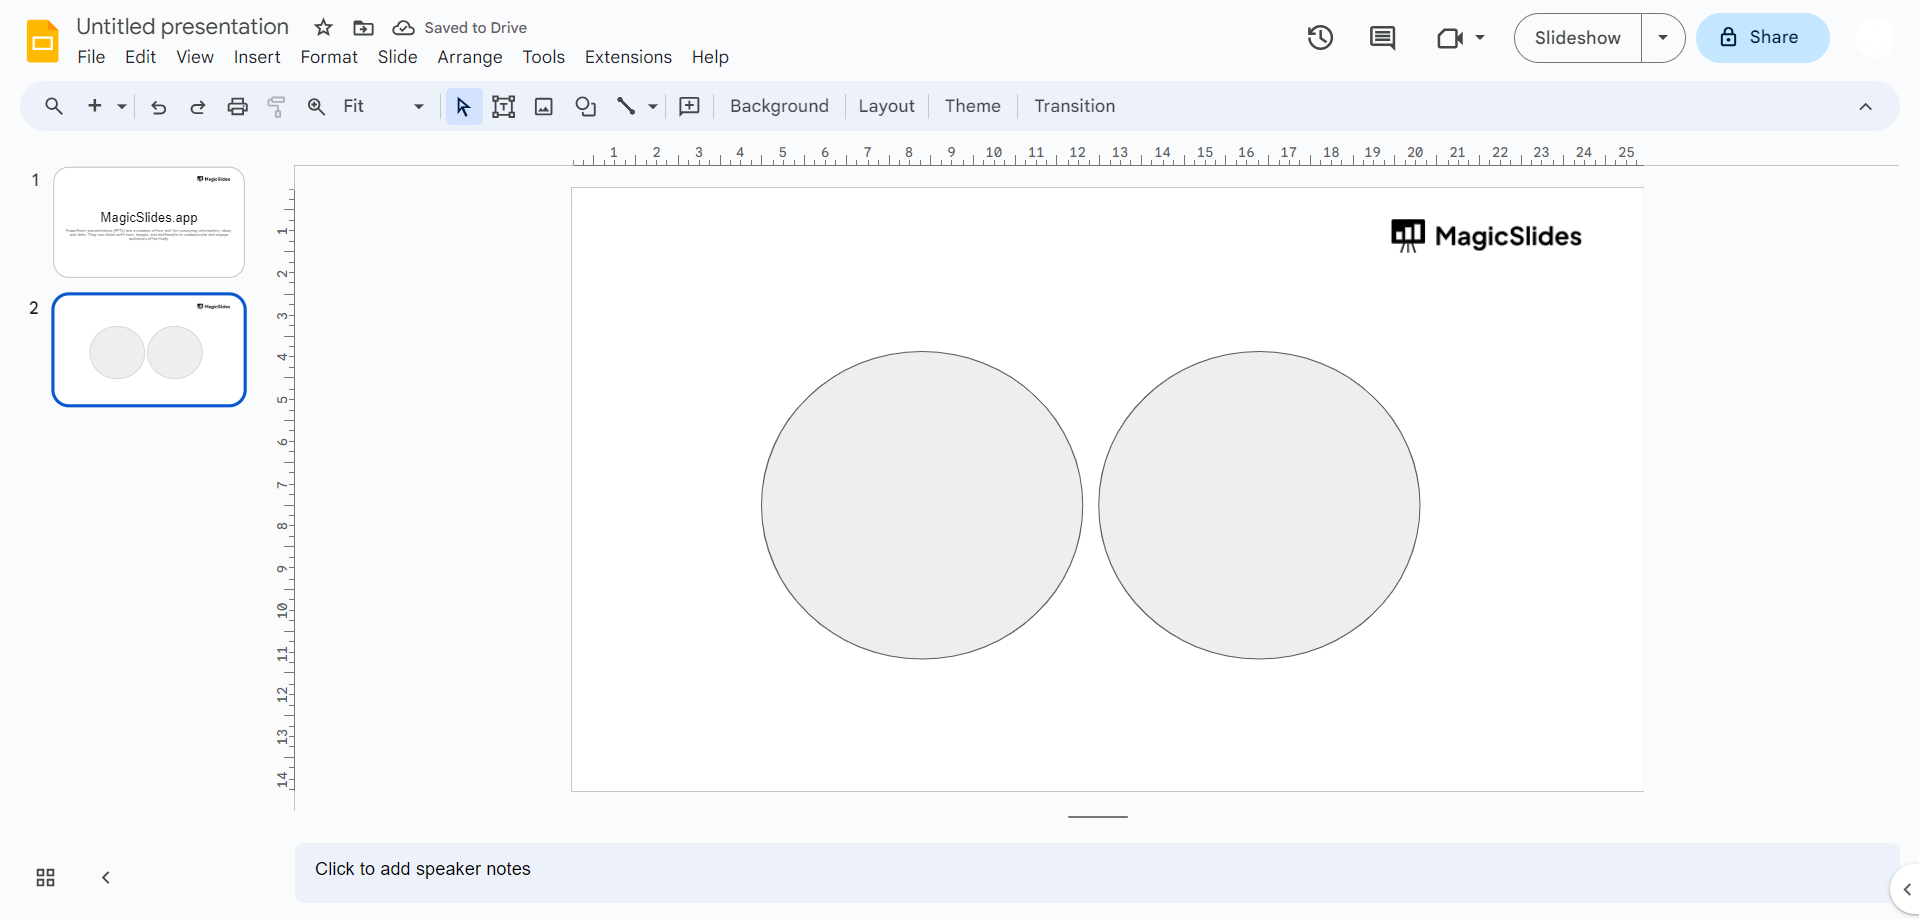
Step 4: Copy and Paste the Circle:
- Right-click on the circle you just created and select "Copy" from the context menu.
- Right-click again and select "Paste." You'll now have a duplicate circle.
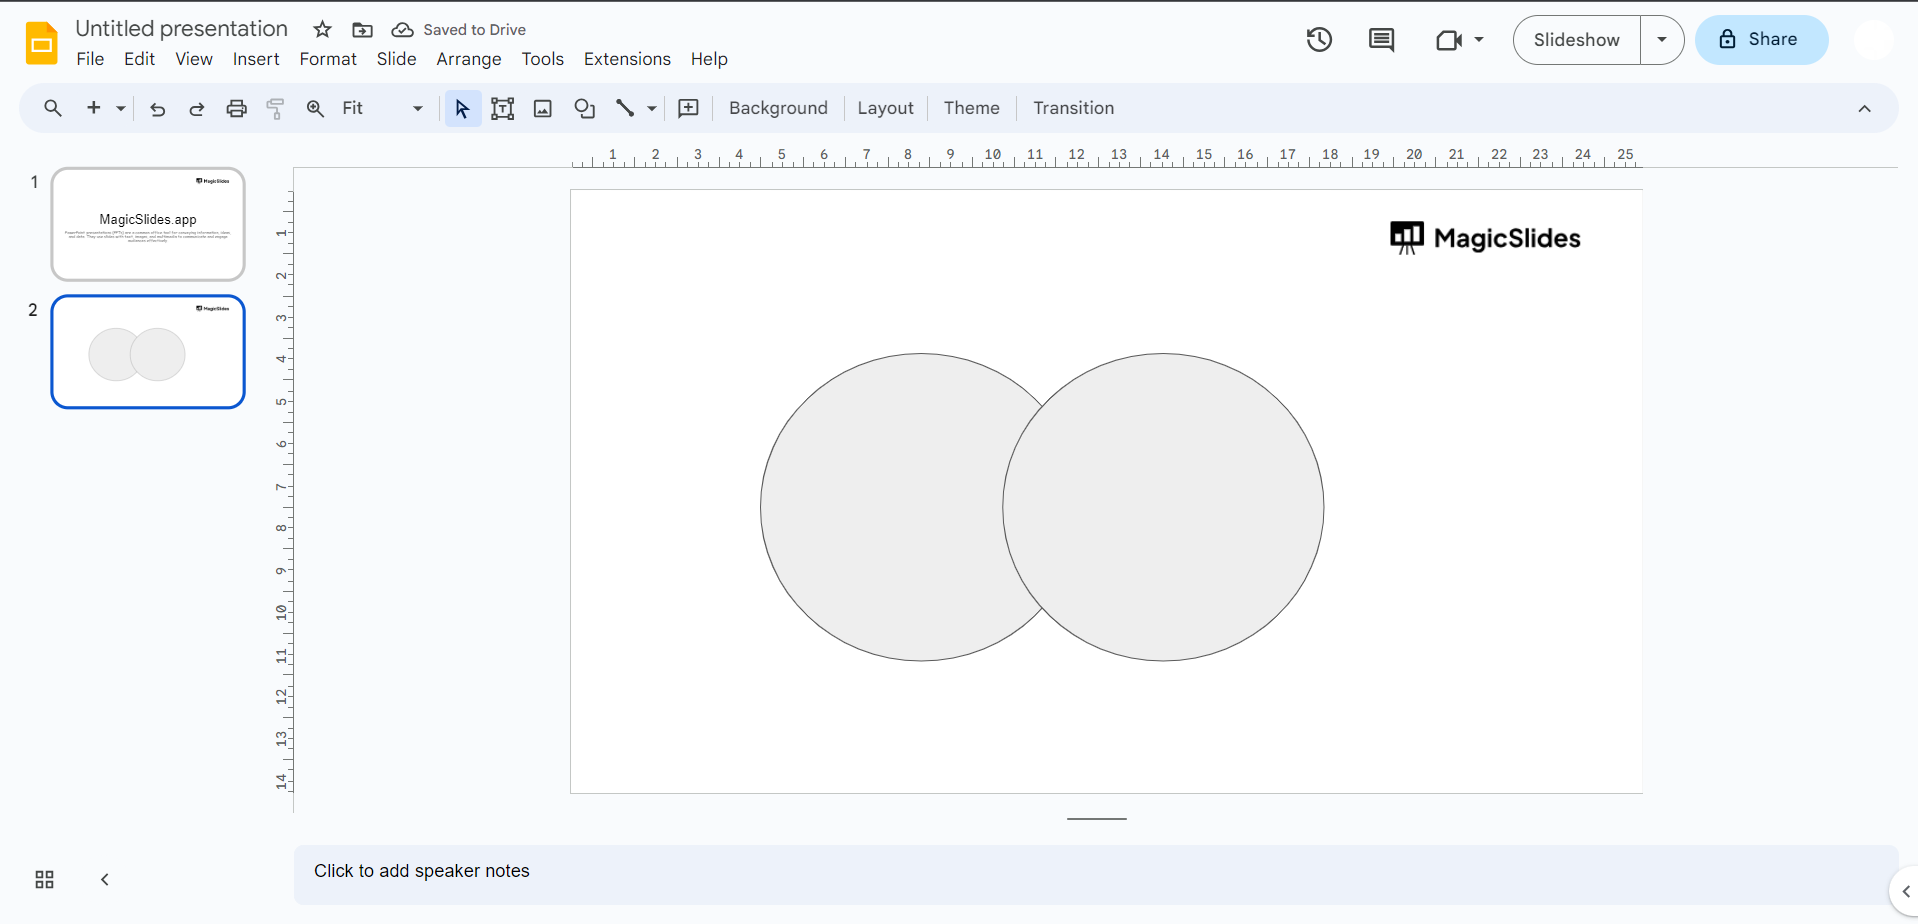
Step 5: Position the Duplicate Circle:
- Move the duplicate circle next to the first one, overlapping slightly. This represents the overlap between the two sets.
Step 6: Customize the Circles:
- You can adjust the size and color of the circles as needed. Click on a circle, then use the resizing handles or change the fill color in the toolbar.
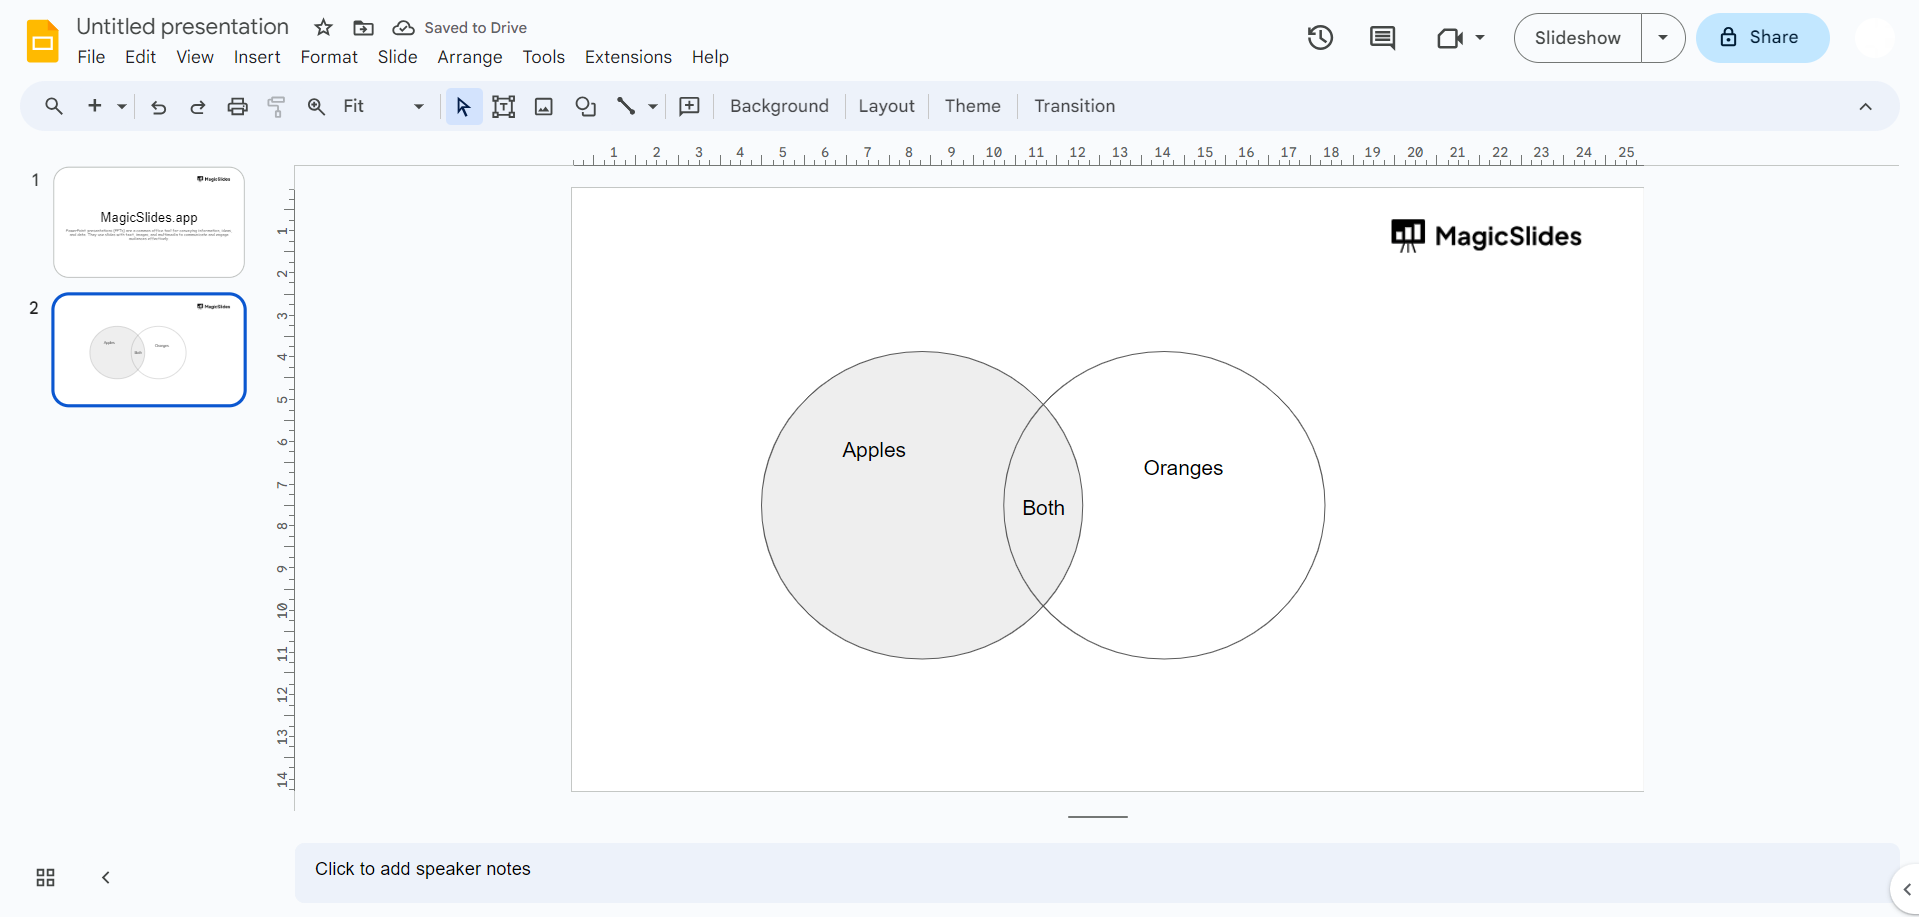
Step 7: Add Text Labels:
- Click on the "Text box" icon in the toolbar and add text labels inside and outside of the circles to label the sets and the overlapping area.
Step 8: Duplicate and Adjust for More Sets:
- To create a three-set Venn diagram, repeat the process by copying and pasting circles and adjusting their positions to create additional overlaps.
Step 9: Connect Overlapping Areas (Optional):
- Use lines or shapes (e.g., rectangles) to connect the overlapping areas, creating a clear visual representation of the relationships between sets.
Step 10: Format and Design:
- Customize the colors, fonts, and styles to make your Venn diagram visually appealing and easy to understand.
Step 11: Arrange Elements:
- Use the "Arrange" menu to control the layering of elements. Bring forward or send backward to ensure everything is properly aligned.
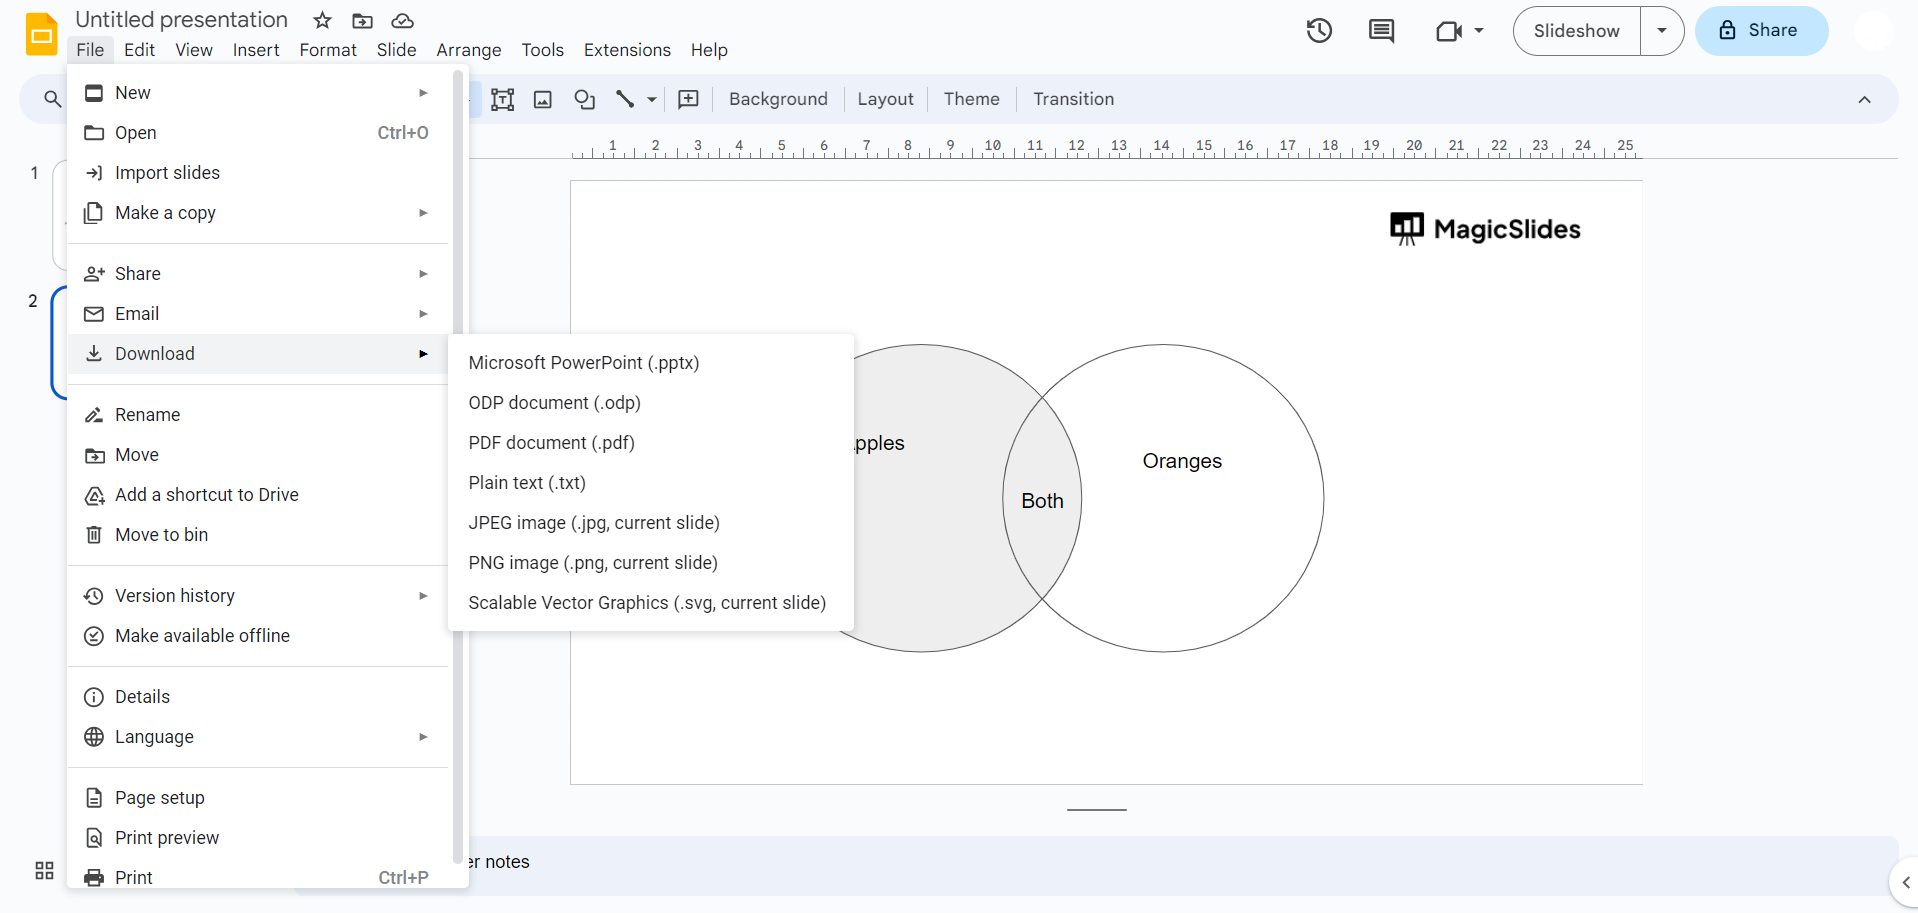
Step 12: Save and Present:
- Once your Venn diagram is complete, make sure to save your presentation. You can then present it or share it with others as needed.
Creating a Venn diagram in Google Slides allows you to visually represent relationships between different sets of data, making complex information more accessible and understandable.


