Addon google slides iconPPT with AISlide TemplatesPPT TemplatesPricingBlog
    PPT with AISlide TemplatesPPT TemplatesPricingBlog
    1. Home
    2. Blog
    3. Can I Add a Table Chart in Canva

    Can I Add a Table Chart in Canva

    Ajay Sai

    Published By

    Ajay Sai

    Approved By

    Admin

    Published On

    January 5th, 2025

    Reading Time

    3 min read

    Create and customize table charts in Canva to visually organize and present your data effortlessly

    Yes, you can create and customize table charts in Canva to effectively present data in your designs.
    Whether you’re making presentations, infographics, or reports, table charts help simplify complex information and make it more visually appealing.
    This guide will walk you through the steps to add a table chart in Canva and customize it to suit your needs.

    Can I Add a Table Chart in Canva? | Steps to Add a Table Chart in Canva

    Step 1: Open Canva and Start a Design

    Log in to your Canva account.
    notion image
    Choose a template or create a blank design where you want to include the table chart.

    Step 2: Access the Table Tool

    Click on “Elements” in the left-hand menu. In the search bar, type “Table” to find available table chart templates.
    notion image

    Step 3: Choose and Insert a Table

    Browse the available table designs and select one that fits your content requirements.
    notion image
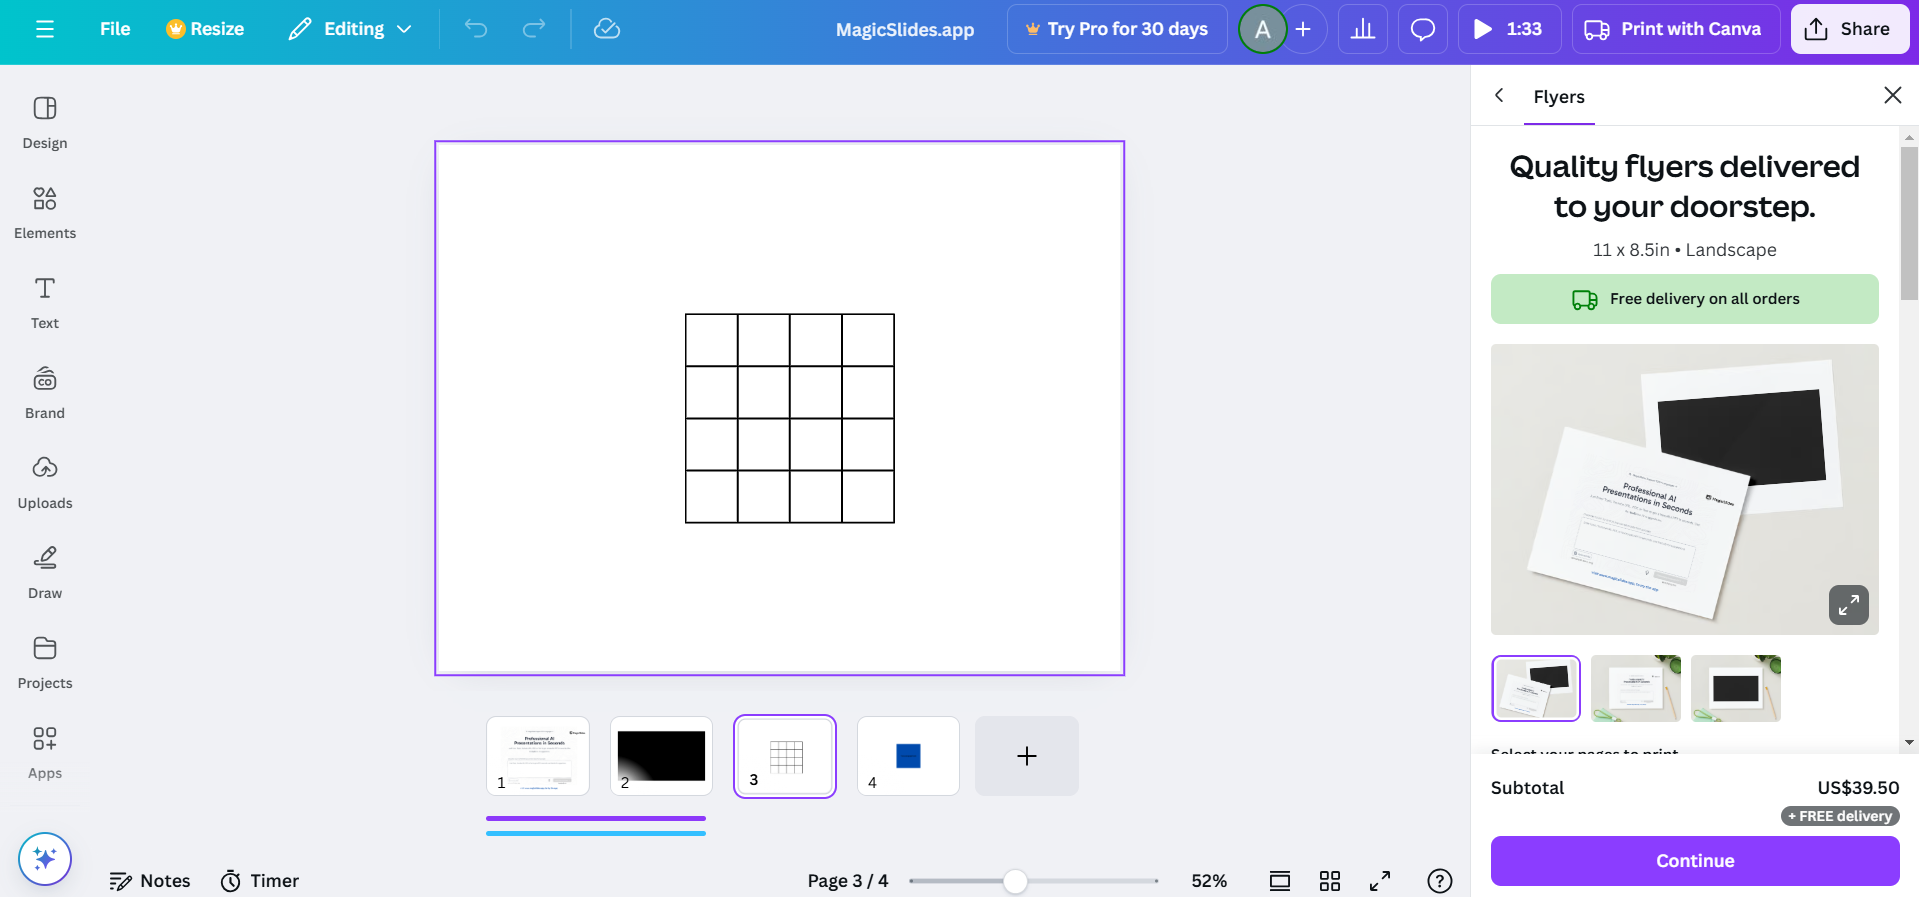
    Drag and drop the selected table onto your design canvas.

    Step 4: Customize the Table Size and Layout

    Click on the table to resize it by dragging the corners.
    notion image
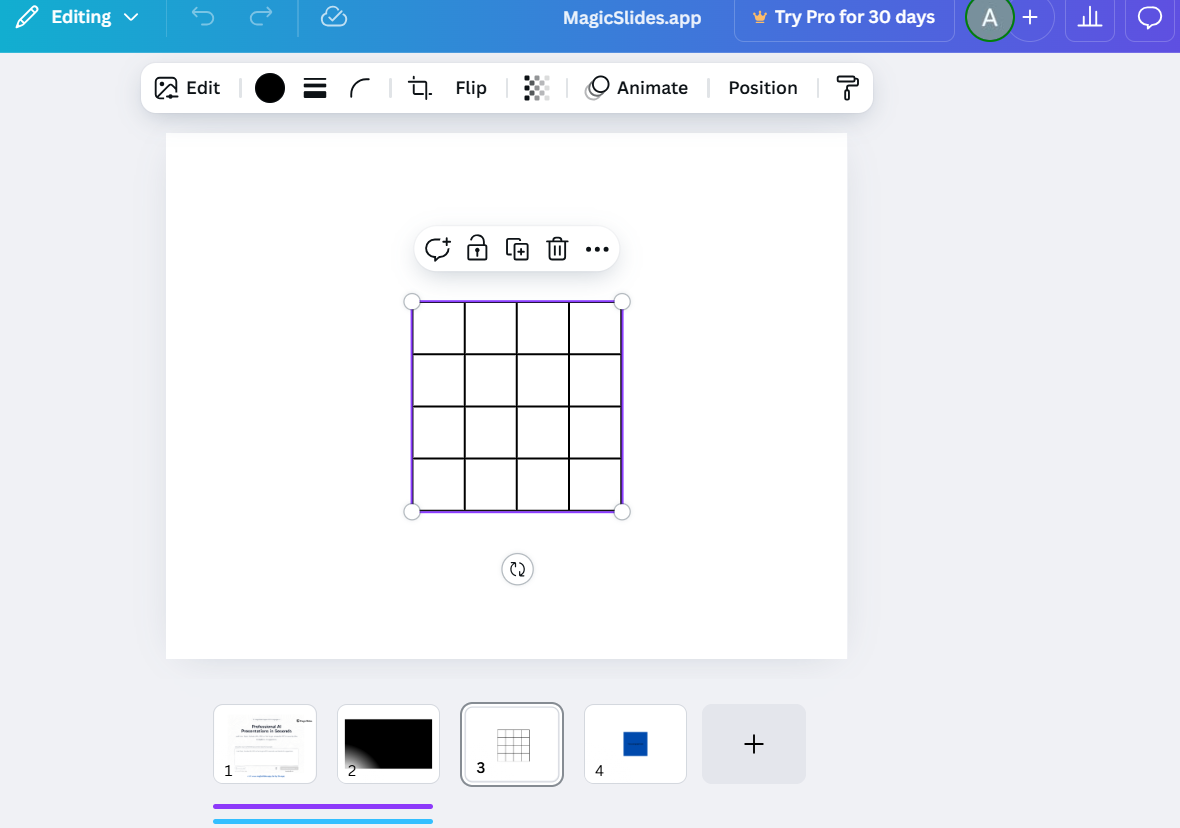
    Adjust the number of rows and columns by clicking on the table and using the toolbar options.

    Step 5: Add and Edit Table Data

    Click on each cell to enter text, numbers, or other data.
    notion image
    Customize the font style, size, and alignment to make the content readable and visually appealing.

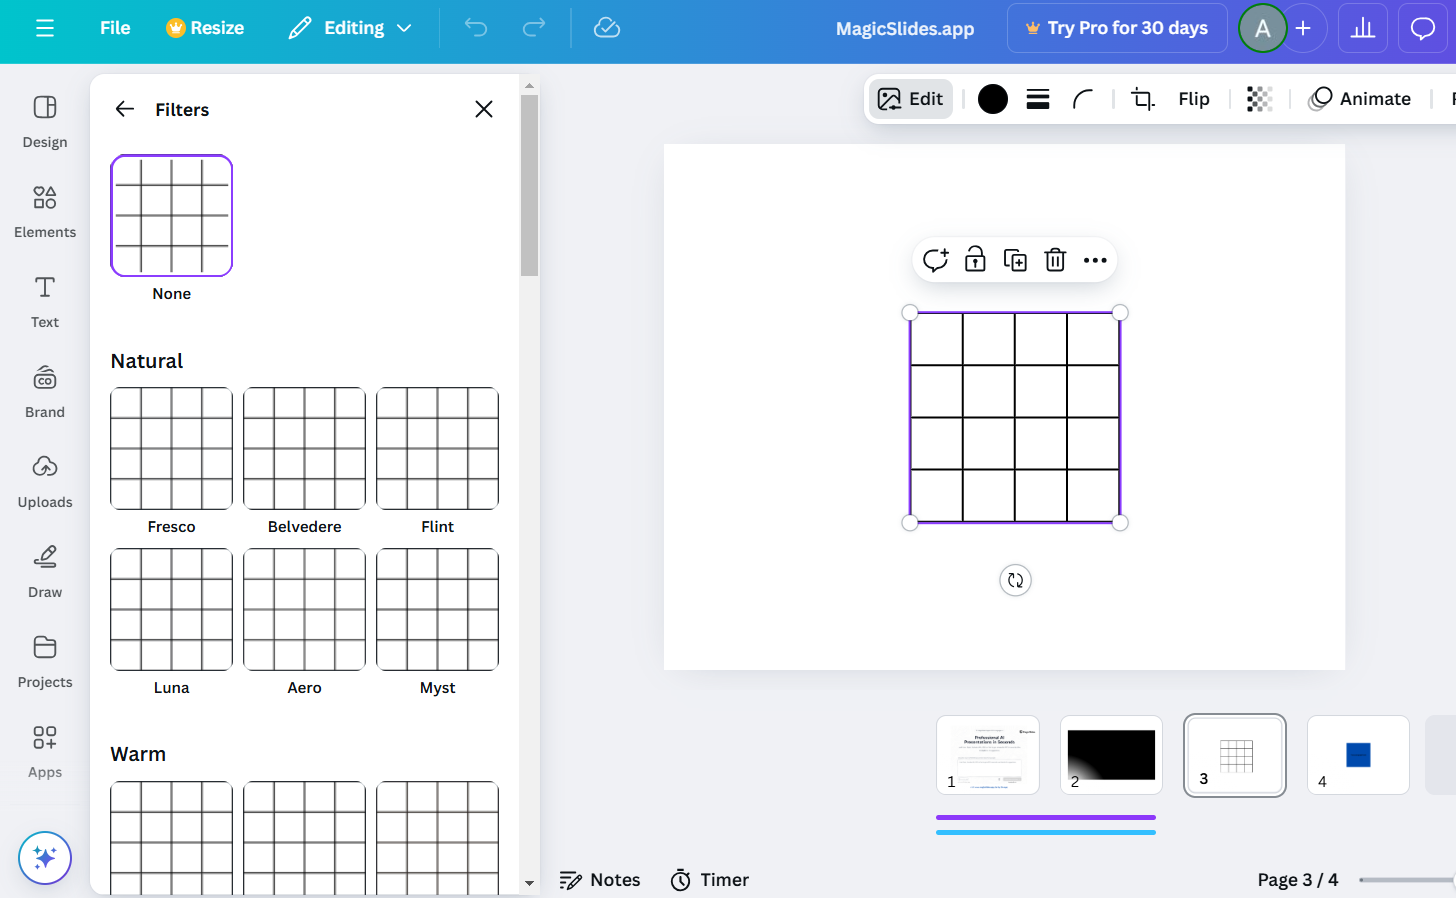
    Step 6: Style the Table

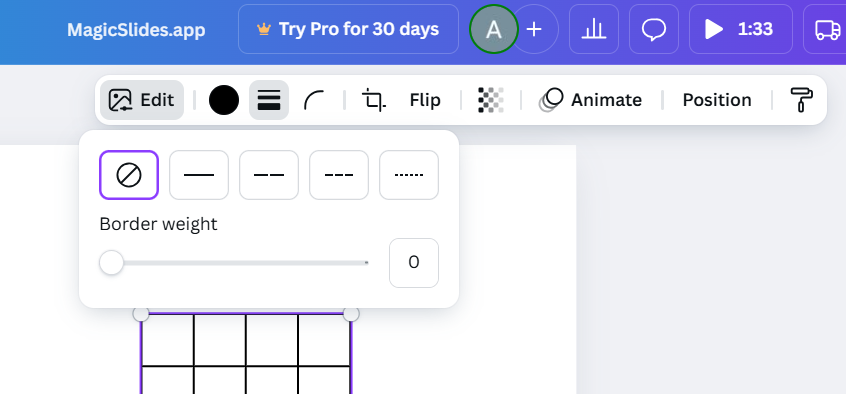
    Use the toolbar to change the table’s colors, including cell backgrounds, borders, and text.
    notion image
    Add shading or alternate colors to rows and columns for better readability.

    Step 7: Final Adjustments and Placement

    Position the table within your design by dragging it to the desired location.
    Ensure the table fits seamlessly with the rest of your design elements.
    Now that you know how to add a table chart in Canva, take your design skills further by learning how to change lengths in Canva for precise adjustments.

    Conclusion

    Adding a table chart in Canva is an effective way to organize and display data visually.
    Canva’s user-friendly tools make it simple to create and customize tables to align with your design objectives.
    By following these steps, you can add professional-looking table charts to your projects and enhance their impact.

    FAQs on Adding a Table Chart in Canva

    Can I import a table from Excel into Canva?

    While Canva doesn’t support direct imports from Excel, you can recreate your table in Canva using its tools.

    Can I customize the borders of a table in Canva?

    Yes! You can adjust the thickness, color, and style of table borders to match your design theme.

    Can I animate a table chart in Canva?

    Yes, Canva allows you to apply animations to table charts, making them more dynamic for presentations.
    By following these steps, you can effectively create and customize table charts in Canva to elevate your design projects!

    Share on socials

    About the author

    Ajay Sai profile photo
    Ajay Sai— writer at MagicSlides.app

    Ajay have been a techincal writer for more than 2+ years. from coding tutorials to using day to day apps he have helped 100k+ visitors with their various queries

    More from Ajay

    More from the blog

      250+ Good Morning Messages for Her (Romantic, Deep, Cute & Sweet)

      30 January 2026

      200+ Heart Touching Birthday Wishes for Sister (Short, Funny and More)

      29 January 2026

      50+ History Presentation Topics For 2026

      28 January 2026

      How to Add Music to Your Canva Presentation: A Step-by-Step Guide

      27 January 2026

      15 Quick Tips To Use ChatGpt At Work

      22 January 2026

      11 Best AI Tools for Business in 2025

      22 January 2026

      How to Create an Infographic That Clearly Communicates Your Message

      20 January 2026

      How to Create a Sales Presentation Template in Google Sheets

      20 January 2026

      How to Make a Pie Chart on Google Slides in Simple Steps

      19 January 2026

    Table of Contents

    Create Presentations in Seconds

    Transform your ideas into professional presentations with AI. No design skills needed.

    Try MagicSlides Free

    Create Stunning Presentations with AI in Seconds ✨

    Transform any topic, text, YouTube video, PDF or URL into beautiful presentations instantly with MagicSlides AI.

    Try MagicSlides AI Presentation Maker
    MagicSlides AI Presentation

    Footer

    Solutions

    • MagicSlides App
    • Google Slides Add-on
    • MagicSlides in Chrome
    • MagicSlides in Figma
    • MagicSlides in ChatGPT
    • MagicSlides in Telegram
    • MagicSlides in Zapier
    • MagicSlides in Figma Slides

    Tools

    • AI PPT Tools
    • QR Code Generator
    • Design Tools
    • PPT Templates
    • Slide Templates
    • PDF Tools

    Examples

    • AI Presentations
    • PPT by MagicSlides
    • Quizzes
    • Charts
    • Coloring Pages

    Resources

    • Changelog
    • Documentation
    • API Docs

    Top Blogs

    • How to Create Presentation Using ChatGPT
    • 100+ Best Seminar Topics for Students in 2025

    Company

    • Help
    • MCP
    • Blog
    • Pricing
    • Affiliate Program
    • Manage Subscription
    • Privacy Policy
    • Contact Us
    • Terms & Conditions
    • Refund & Cancellation Policy

    We also built

    • SheetAI - GPT For Sheets
    • MagicForm - GPT For Google Forms
    • SecondBrain.fyi
    • BlogBee - Free Blogging Platform

    © 2026 IndianAppGuy Tech Pvt Ltd. All rights reserved.