How to Animate Parts of a Graph in PowerPoint


Animate parts of a graph in PowerPoint to present data dynamically and engage your audience effectively
How to Animate Parts of a Graph in PowerPoint
Animating parts of a graph in PowerPoint helps present data effectively by revealing key insights step by step.
This method keeps your audience engaged and prevents information overload.
Follow this guide to animate specific elements of your graph seamlessly.
Steps to Animate Parts of a Graph in PowerPoint
Step 1: Insert or Select a Graph in PowerPoint
Open PowerPoint and navigate to the slide where you want to animate a graph.
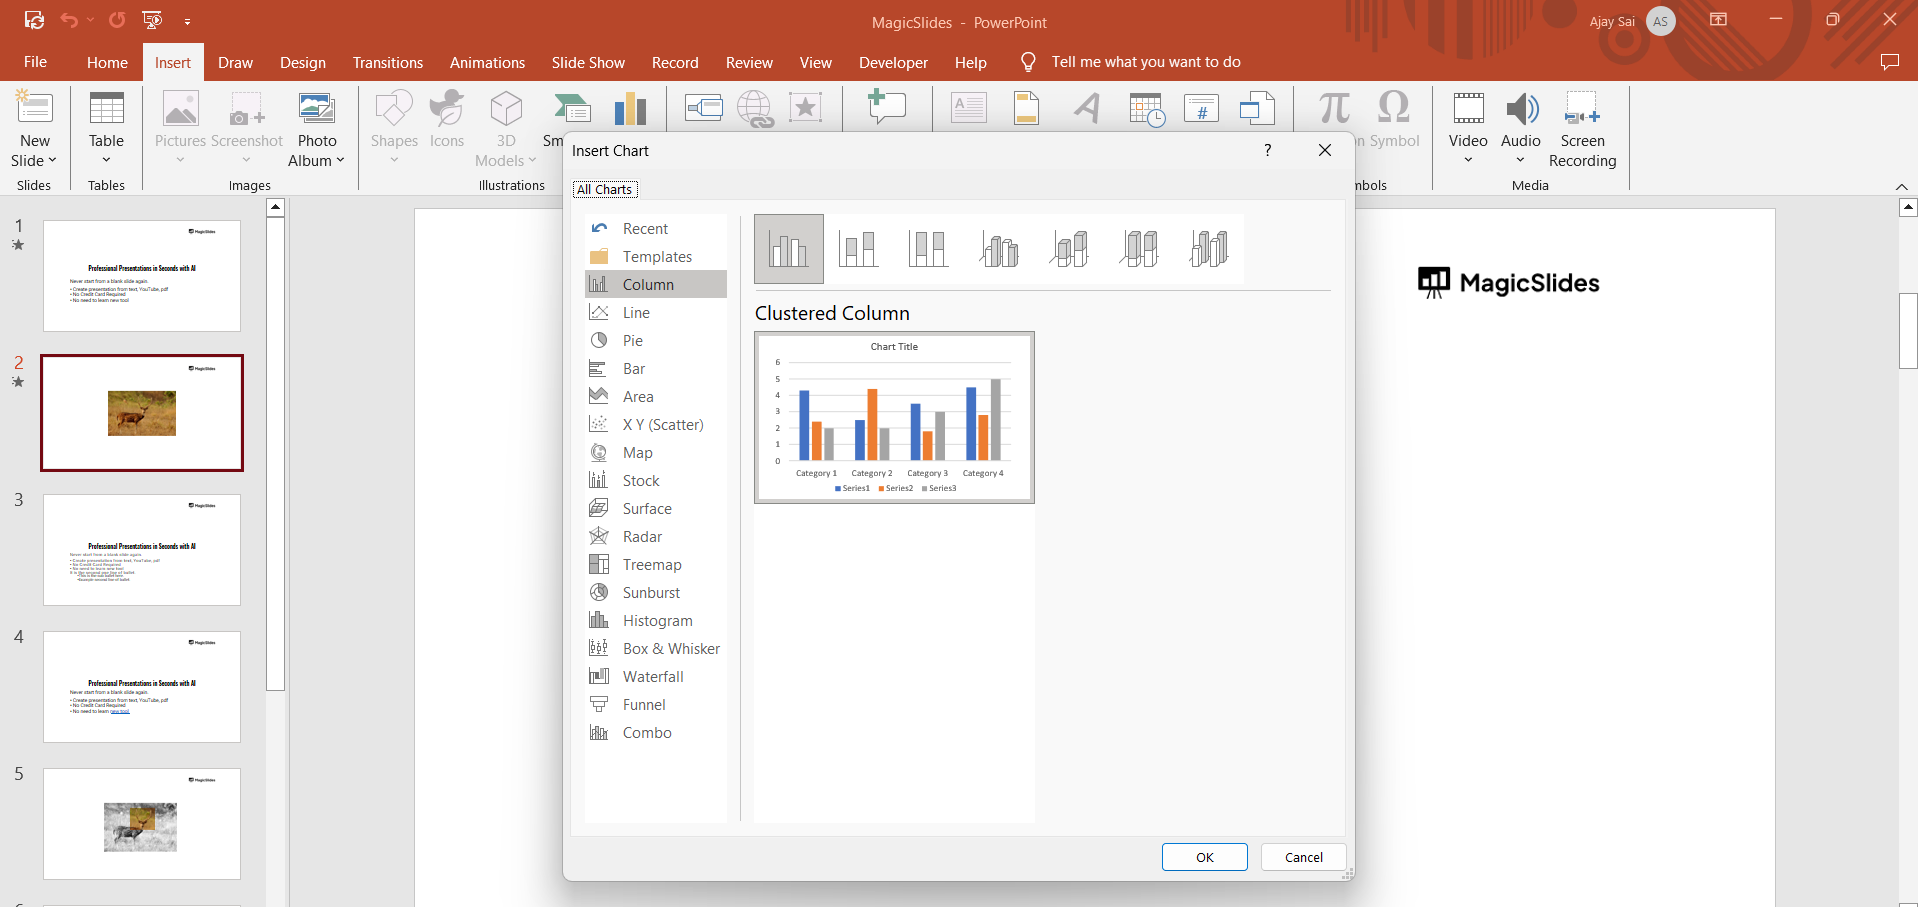
If you don’t have a graph yet, go to Insert → Chart and choose the type of graph you need.
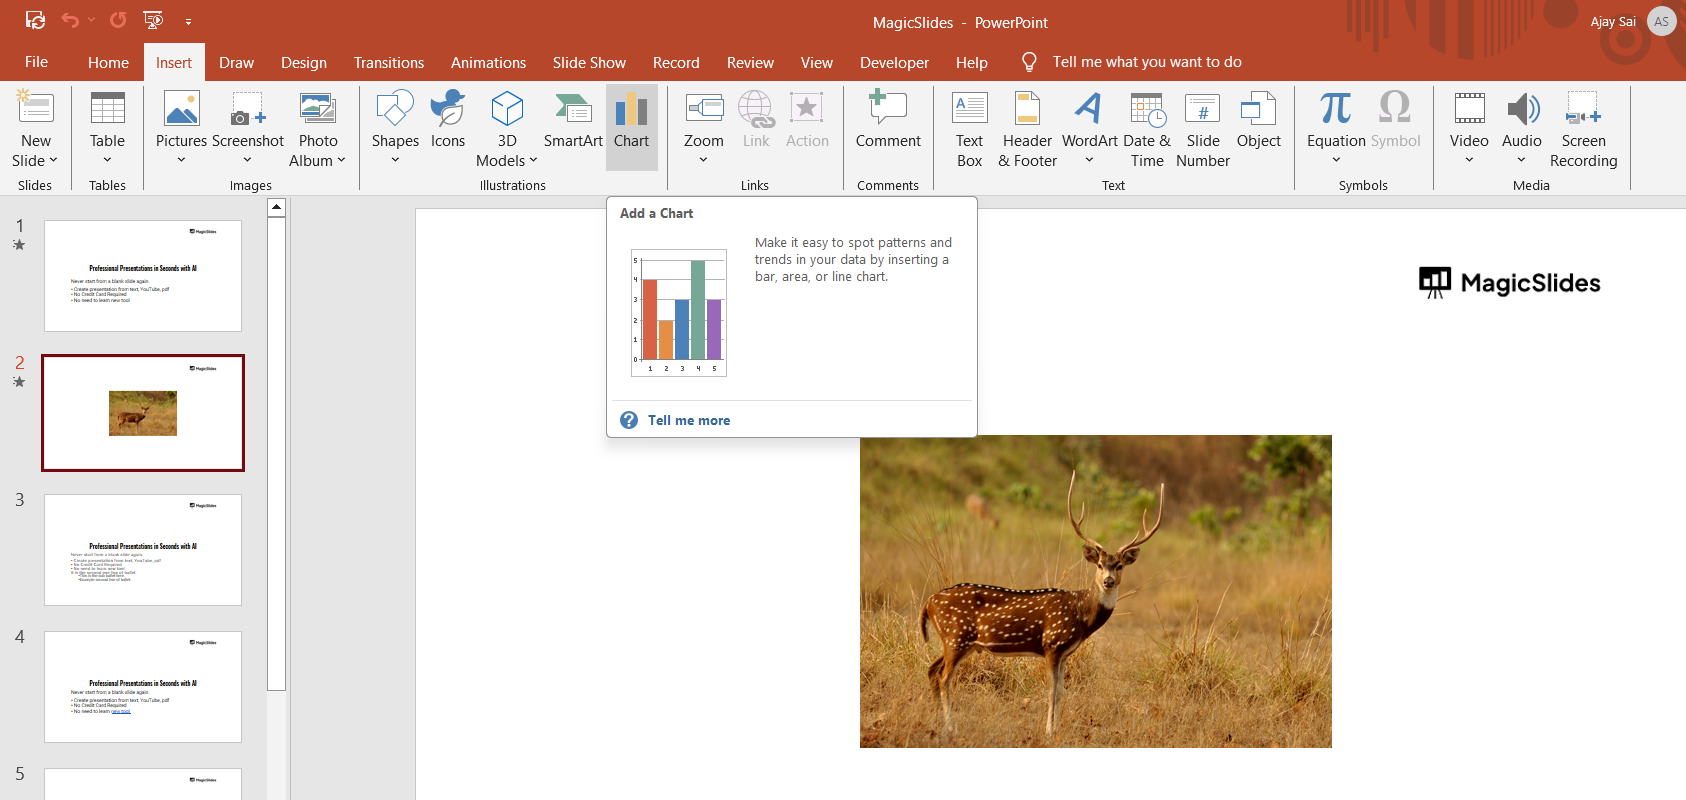
Click OK to insert the graph.
Step 2: Open the Animation Pane
Click on the graph to select it.
Go to the Animations tab on the ribbon. Click on Animation Pane to open a sidebar that helps manage animations.
Step 3: Apply an Animation to the Entire Graph
With the graph selected, choose an animation from the Animations tab, such as Appear, Fade, or Wipe.
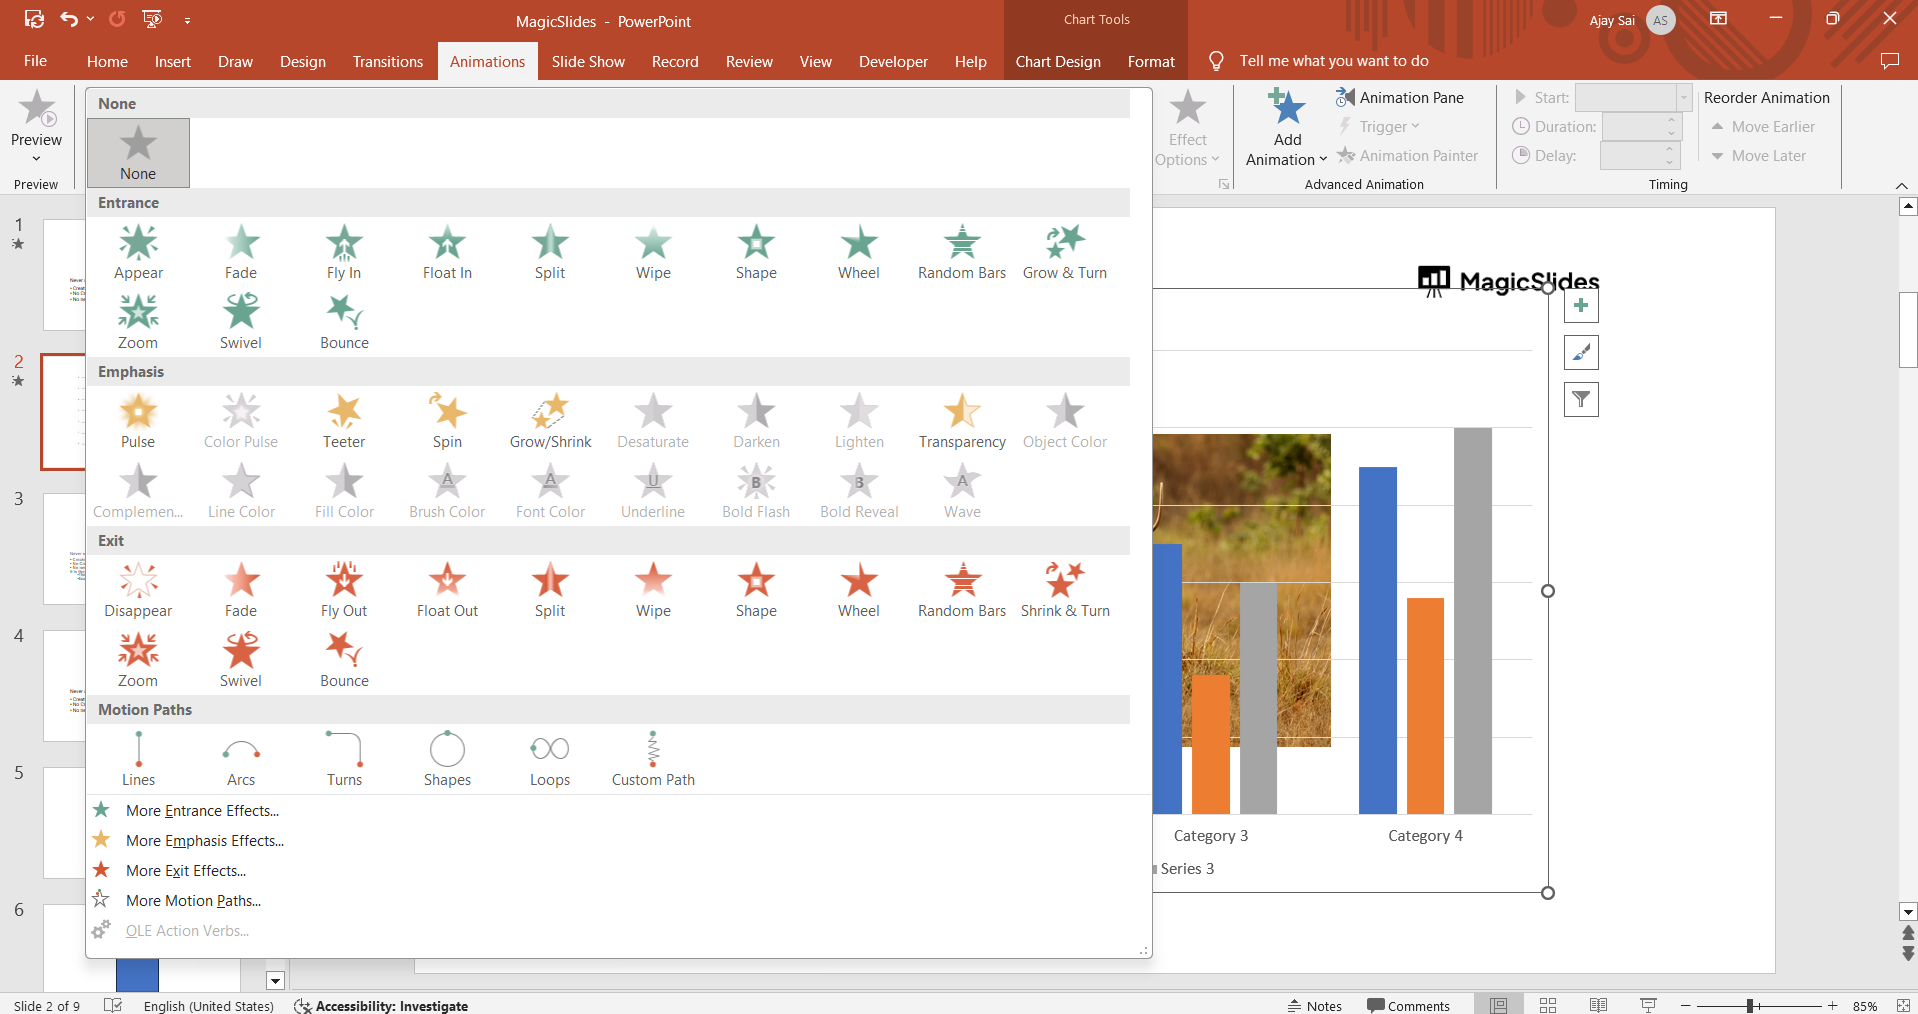
This animation applies to the whole graph, but we will break it down into parts in the next step.
Step 4: Animate Individual Graph Elements
Click on the graph, then go to the Animations tab. Click Effect Options, and choose By Series, By Category, By Element in Series, or By Element in Category to animate specific parts.
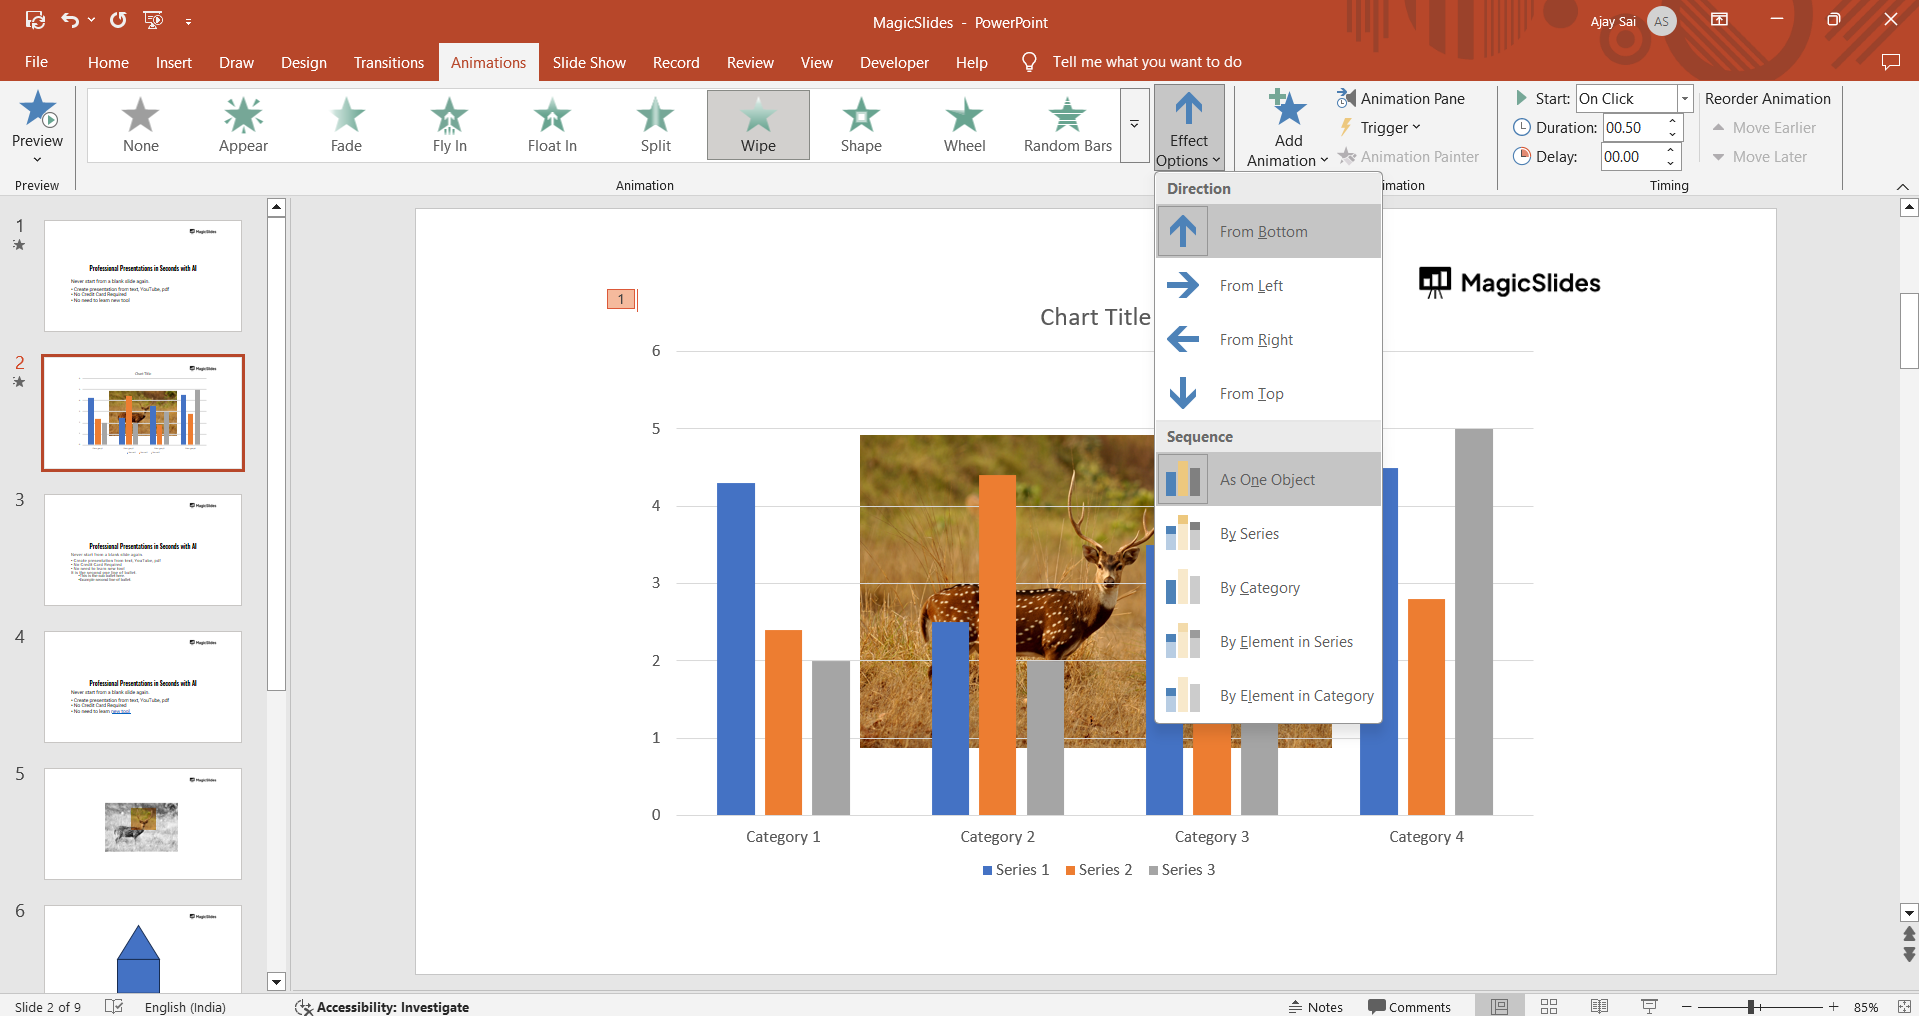
This ensures that different sections of the graph appear one at a time.
Step 5: Customize Animation Timing
Open the Animation Pane (if not already open).
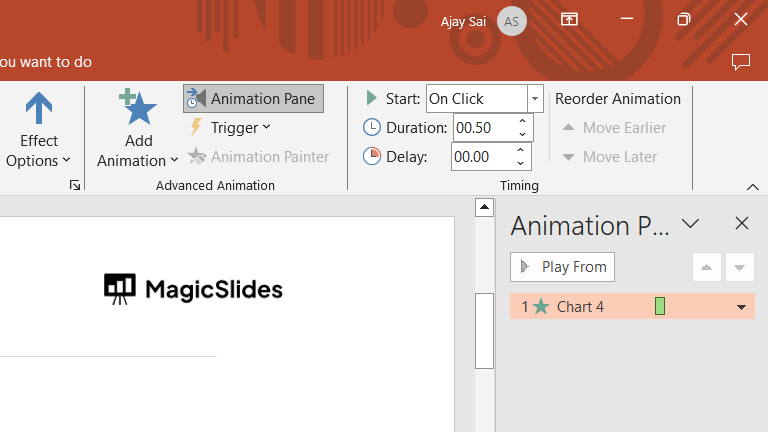
Click on each animated element and adjust the Start option:
- On Click – Each element appears when you click.
- With Previous – The animation plays automatically with the previous one.
- After Previous – The animation starts after the last one finishes.
Modify the Duration and Delay to control the speed and timing of the animations.
Step 6: Preview and Refine Animations
Click Play All in the Animation Pane to preview the effect. Adjust the order, speed, or animation type as needed to enhance clarity and engagement.
Animating parts of a graph can make your data more engaging, but if you want an effortless way to create compelling presentations, try MagicSlides.app. It instantly generates professional slides with dynamic elements!
Conclusion
Animating parts of a graph in PowerPoint helps you present data dynamically, allowing you to highlight trends and key takeaways.
By controlling when and how each graph element appears, you ensure a smoother, more impactful presentation.
FAQs on Animating Graphs in PowerPoint
Can I animate individual bars in a bar chart?
Yes! Use Effect Options and choose By Element in Series or By Element in Category to animate bars separately.
What animation works best for graphs?
Fade, Wipe, and Appear work well because they smoothly introduce data without being distracting.
Can I control the order in which elements appear?
Yes! Use the Animation Pane to drag and reorder animation sequences for better flow.
Now you can animate graphs in PowerPoint to make your data presentations more engaging and interactive! 🚀


