How to make an Infographic in PowerPoint


Creating infographics in PowerPoint helps present data visually, making complex information clear and engaging
Creating an infographic in PowerPoint is a simple yet effective way to present data visually.
With its wide range of design tools, PowerPoint makes it easy to build an engaging infographic that captures your audience’s attention and communicates complex information in an appealing way.
Here’s a step-by-step guide to creating your own infographic in PowerPoint.
How to Make an Infographic in PowerPoint: A Step-by-Step Guide
Step 1: Set Up Your Slide Layout
Open a new PowerPoint slide and choose a layout.
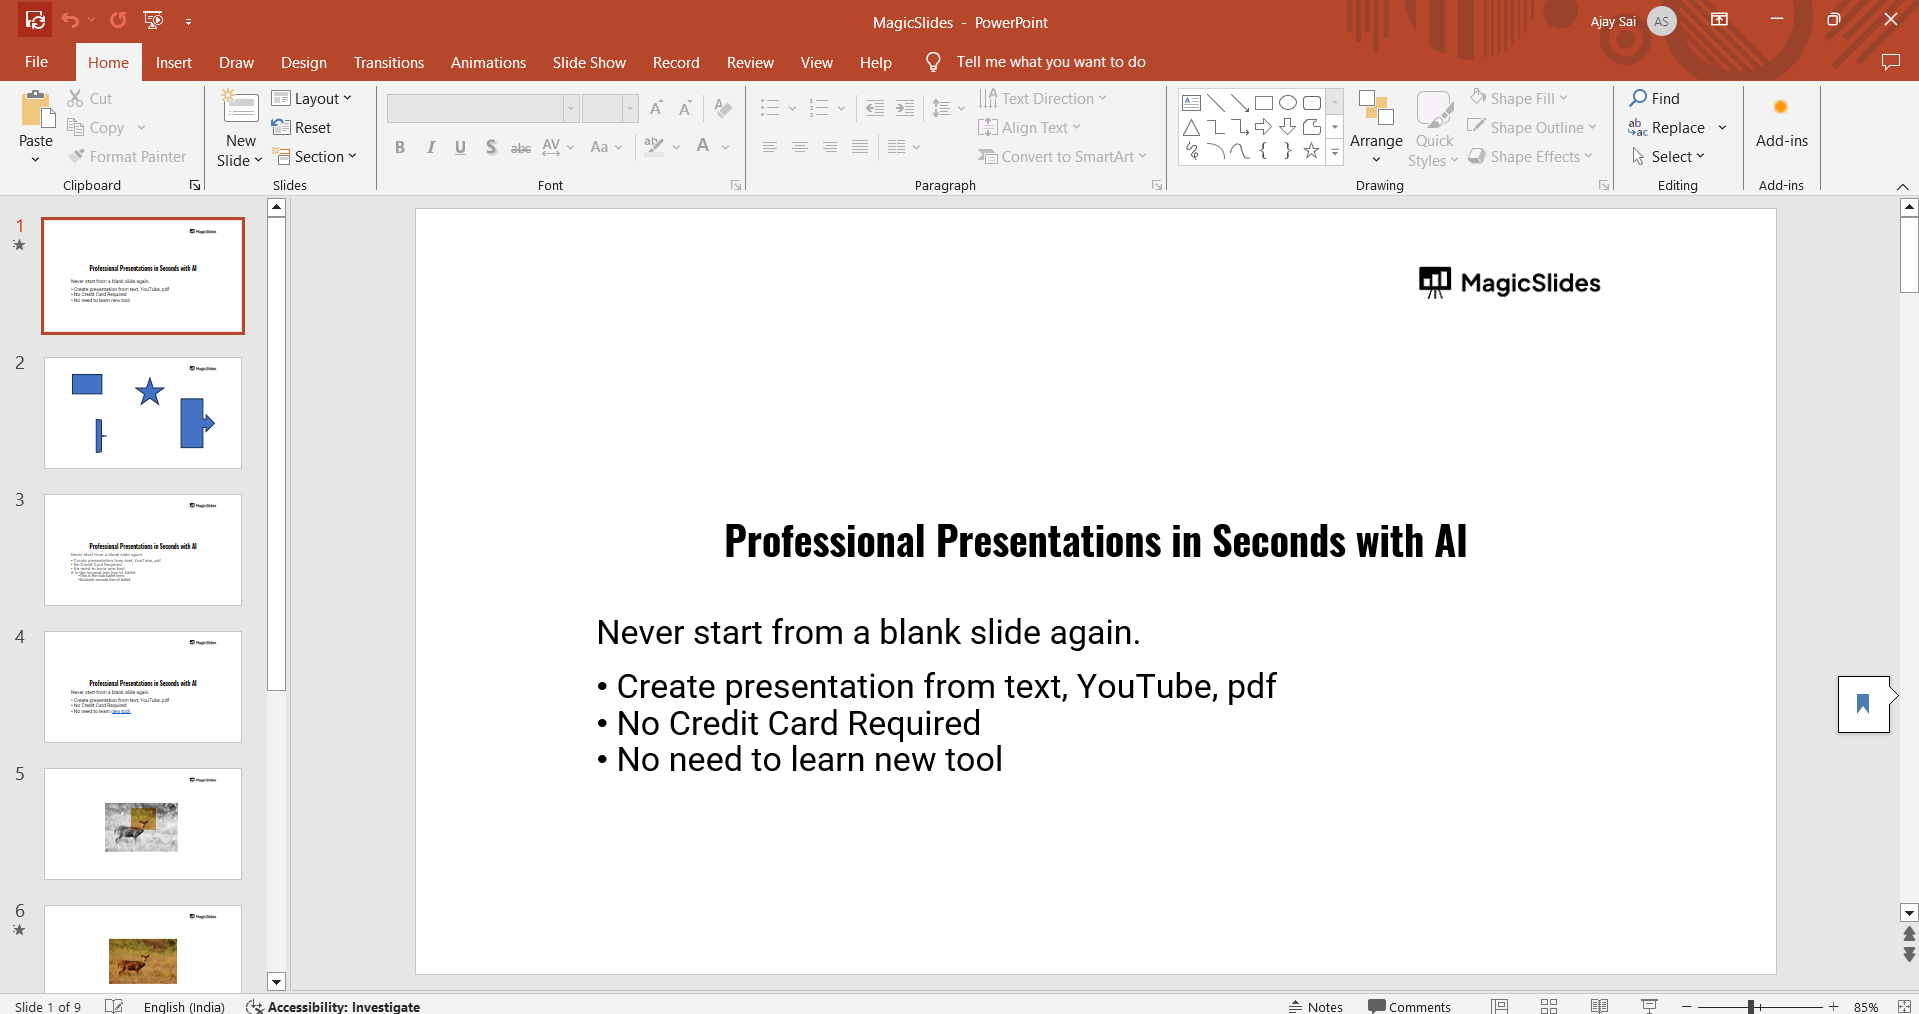
Start by selecting a blank slide to give yourself plenty of space to work with.
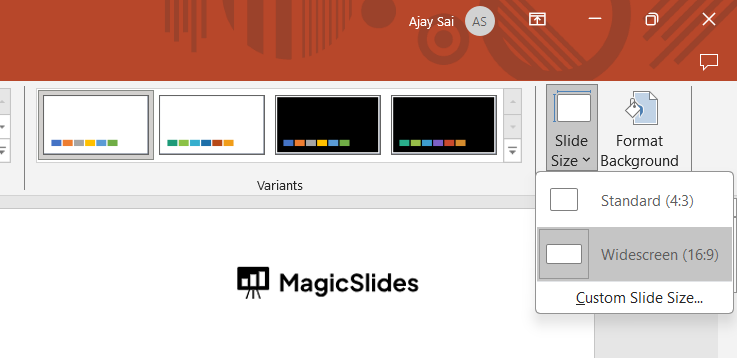
You can also adjust the slide dimensions if you prefer a custom size by going to the "Design" tab and selecting "Slide Size."
Step 2: Choose a Theme or Background
To add visual appeal, select a theme or background that complements your infographic’s content.
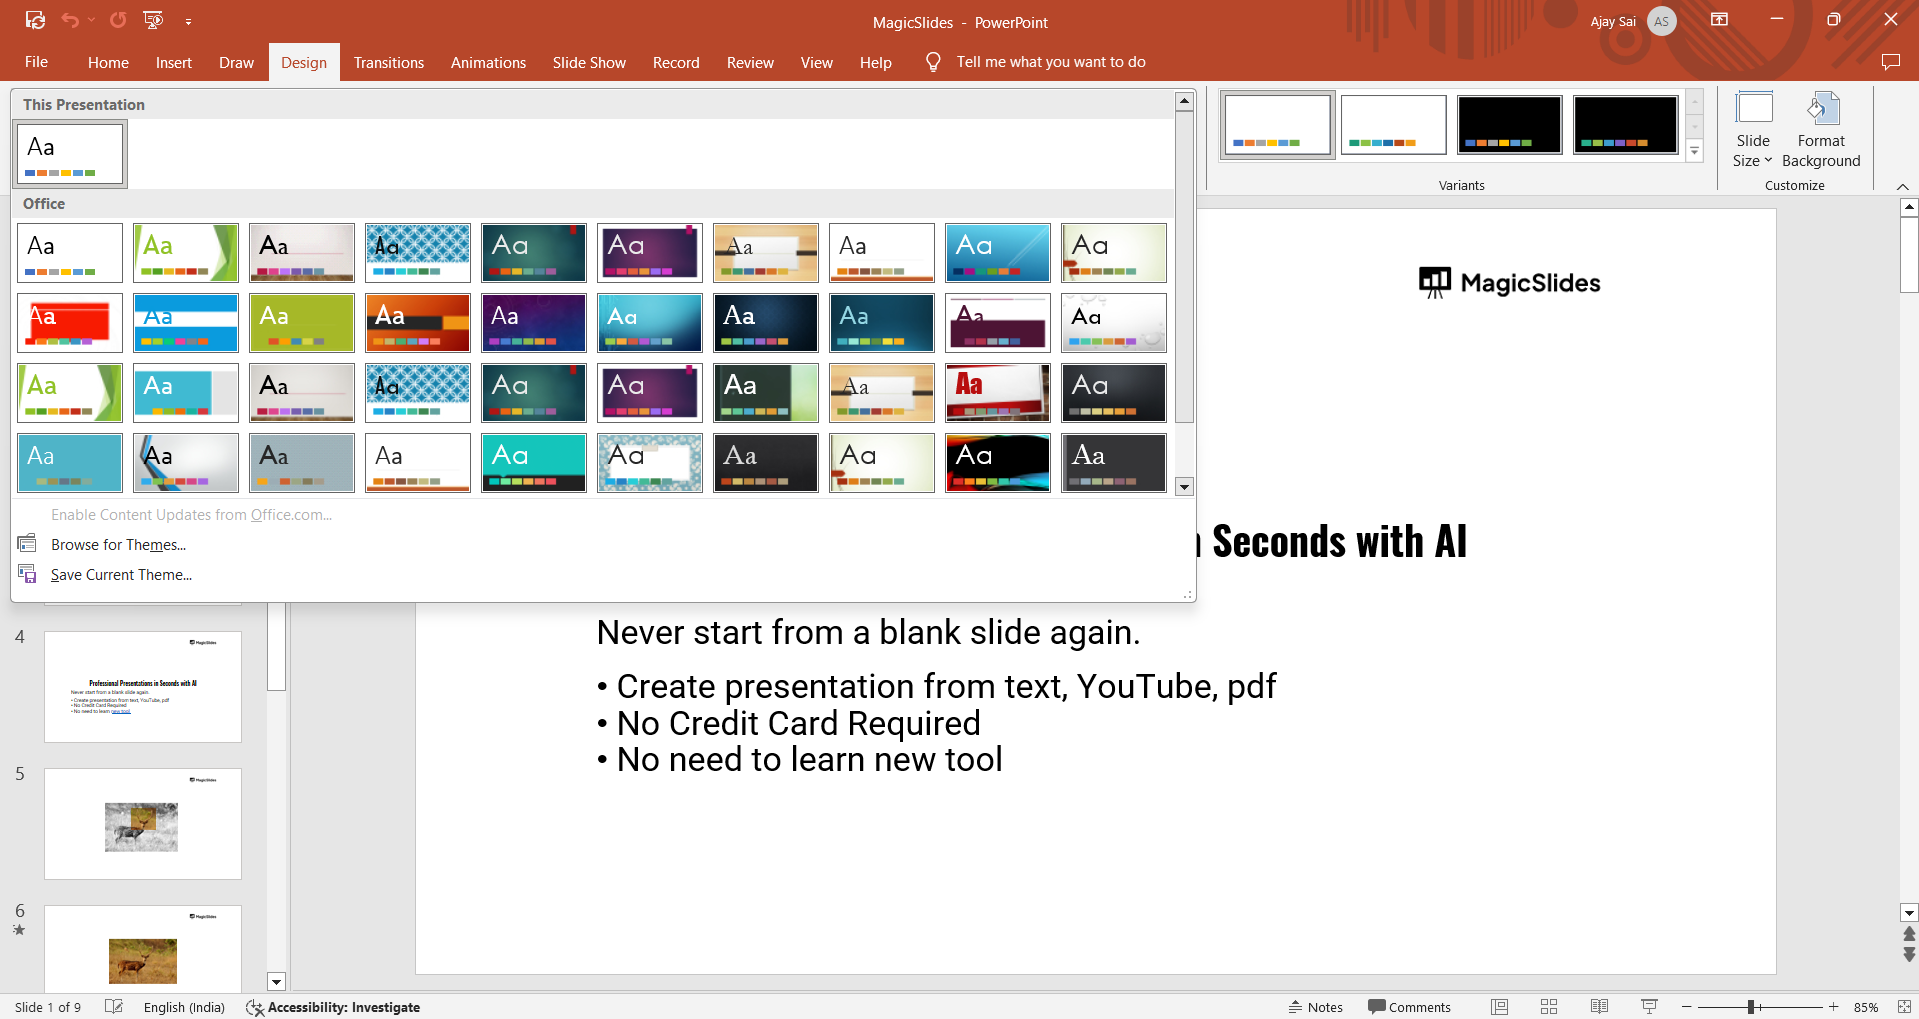
Click on the "Design" tab to explore PowerPoint’s built-in themes or select “Format Background” to choose solid colors, gradients, or images for a custom background.
This will set the tone and style for your infographic.
Step 3: Insert Shapes and Icons
Use shapes and icons to represent key data points and categories.
Go to the "Insert" tab and select "Shapes" or "Icons" to add visual elements to your infographic.
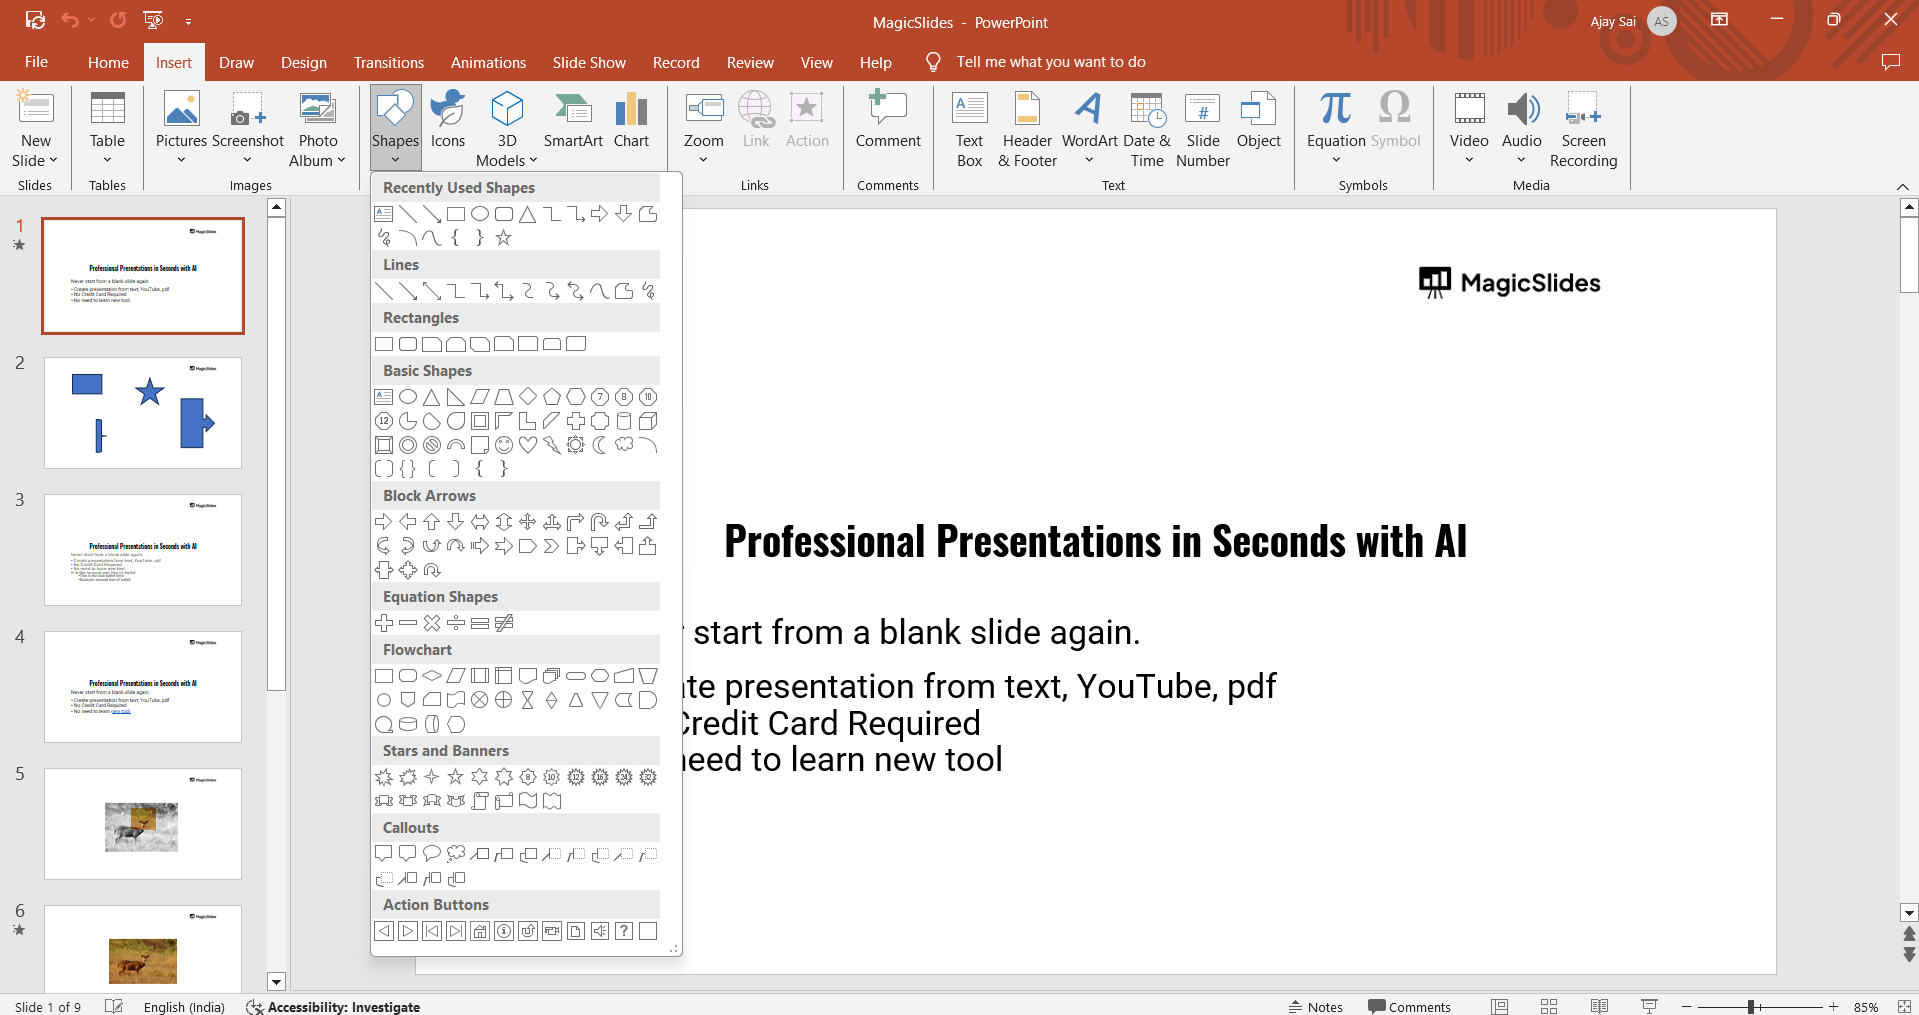
You can resize, move, and color these elements to match your design, using them to guide the viewer’s eye across the slide.
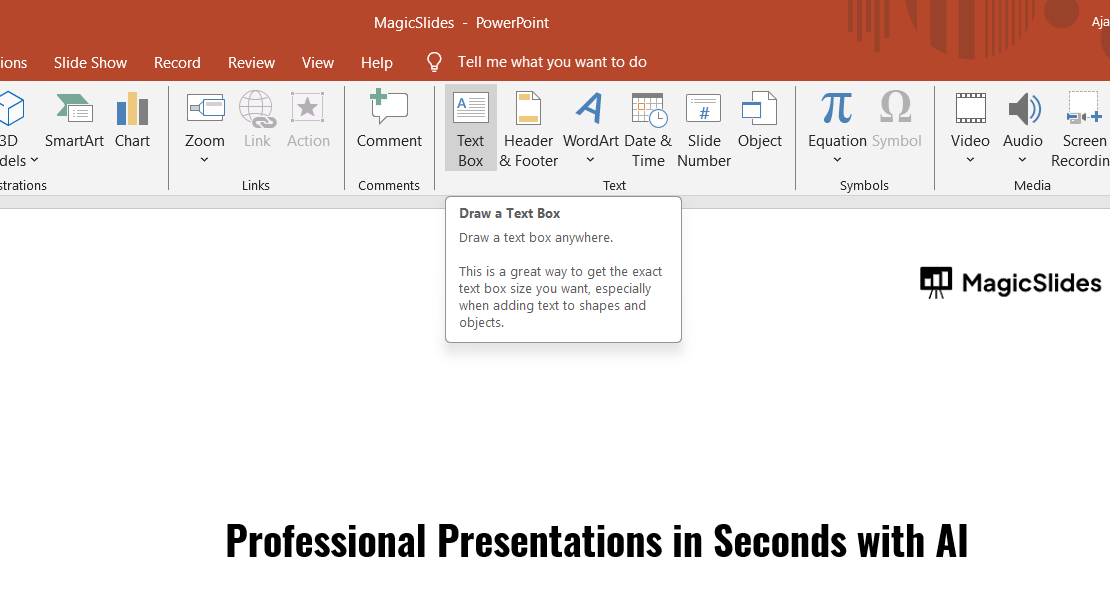
Step 4: Add Text Boxes
Click on "Insert" and select "Text Box" to add your content, such as titles, labels, and descriptions.
Place the text boxes strategically near your icons and shapes to keep the information organized.
Use clear, concise text and choose a readable font that aligns with your design theme.
Step 5: Customize Colors and Fonts
Make your infographic visually appealing by customizing colors and fonts. Go to the "Home" tab and use the "Font" and "Font Color" options to select the right font styles.
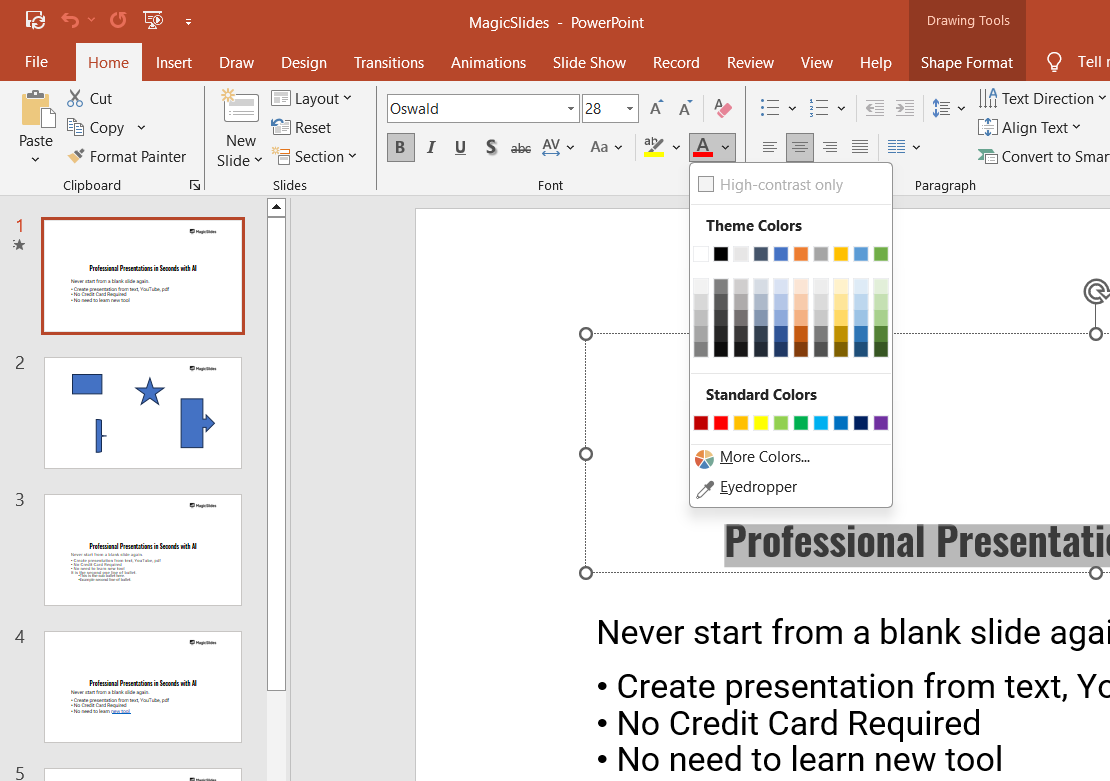
For color consistency, apply a color scheme to both shapes and text, giving your infographic a cohesive look.
Step 6: Use Charts and Graphs (Optional)
To represent data accurately, consider adding charts or graphs to your infographic.
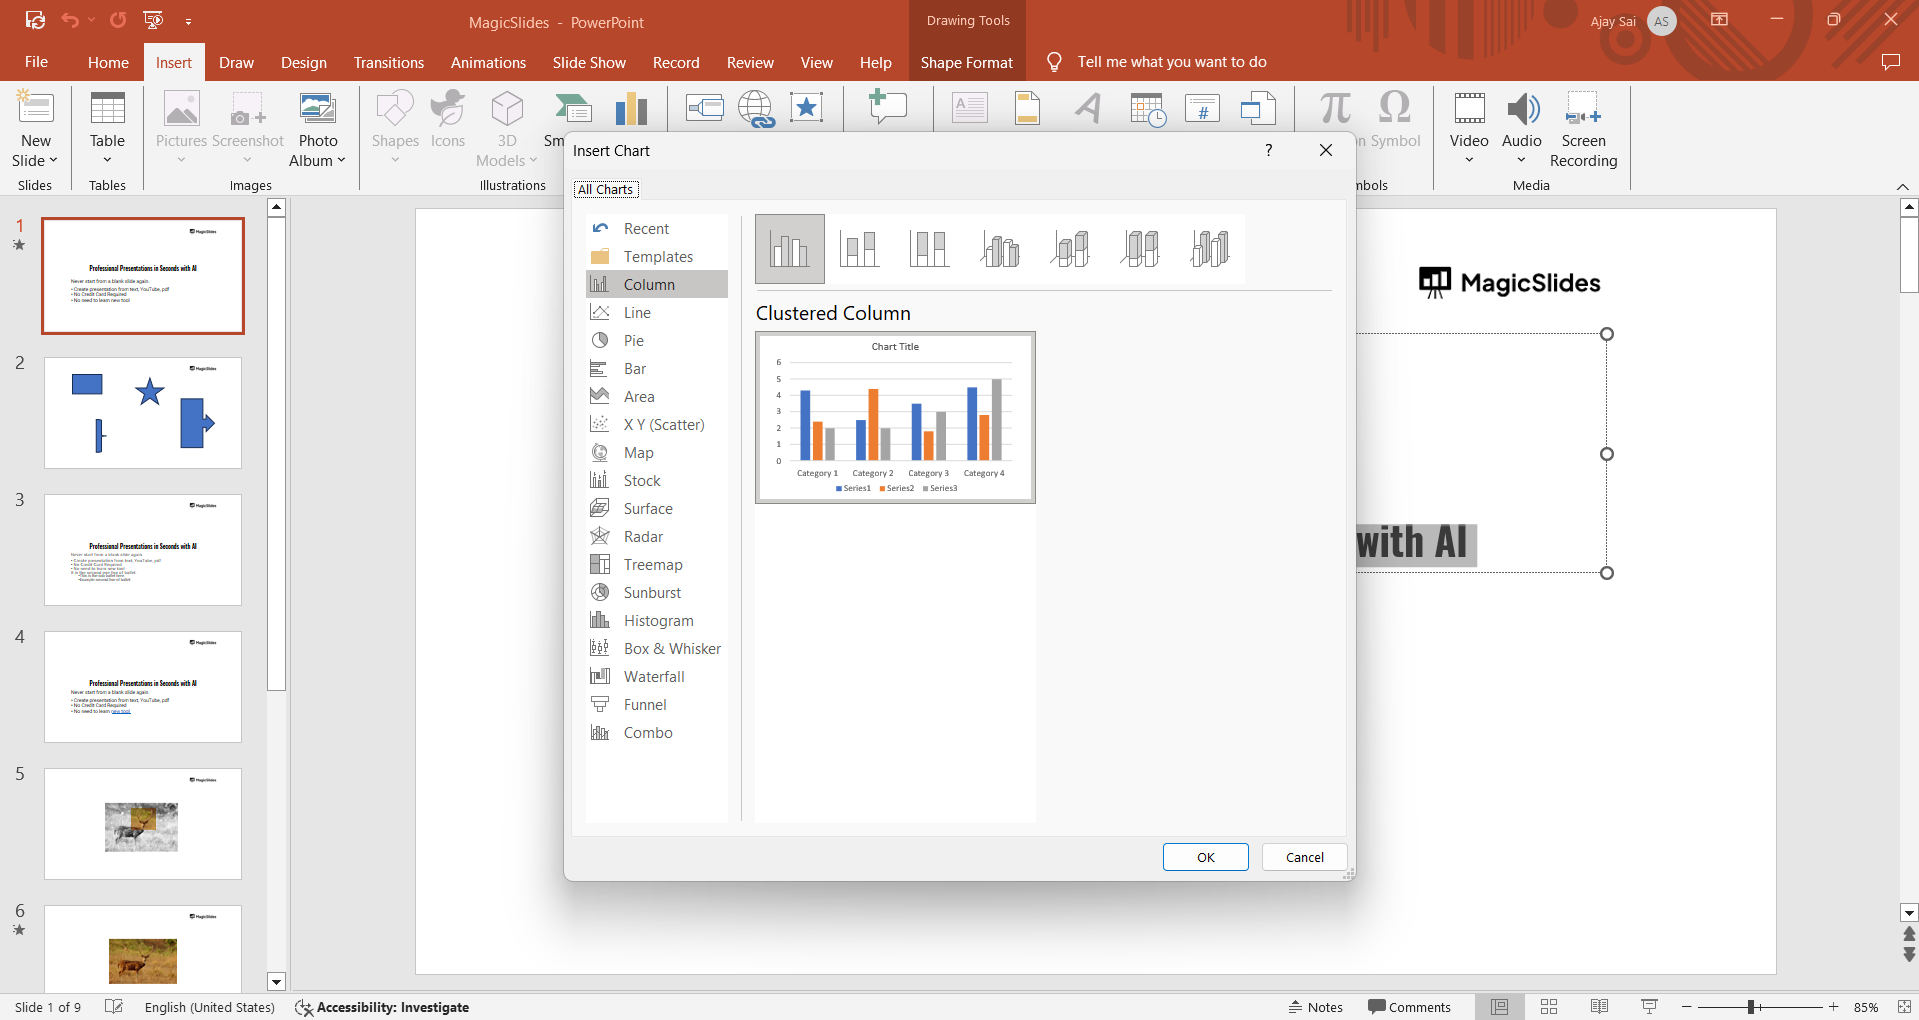
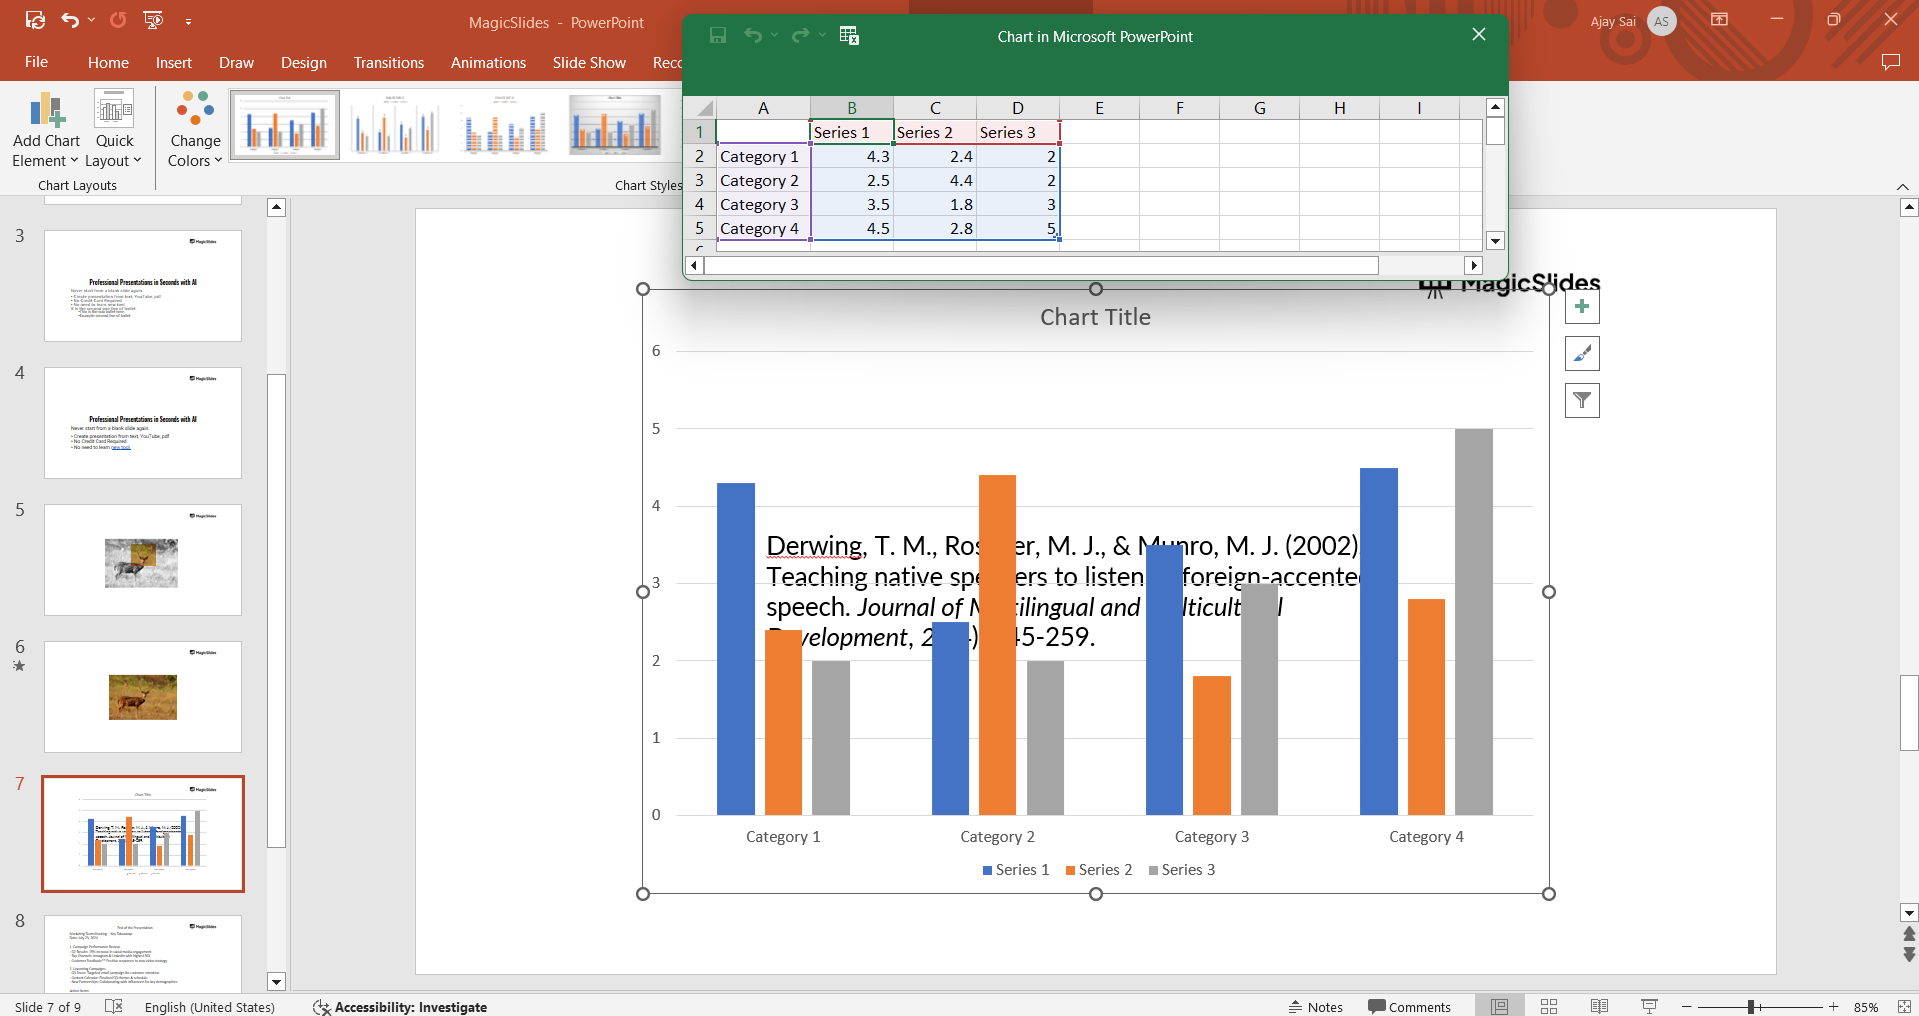
Click on "Insert" and select "Chart," then choose the type that best fits your data, such as bar, pie, or line charts.
Enter your data into the chart, and format it to blend with your infographic’s style.
Step 7: Add Finishing Touches
Review your infographic for any final adjustments. You can add borders, drop shadows, or effects to emphasize certain elements, giving your infographic a polished look.
Once satisfied, preview the slide in full screen to ensure it’s clear and effective.
Now that you know how to make an infographic in PowerPoint, consider learning how to create a roadmap in PowerPoint for visual storytelling that guides your audience.
Conclusion
With PowerPoint’s versatile design tools, creating an engaging infographic is within reach, even for beginners.
Following these steps will help you design a professional, visually appealing infographic that effectively communicates your data.
Infographics created in PowerPoint can add impact to presentations and ensure your audience stays engaged and informed.
FAQs are here to help!
Can I use PowerPoint templates to make an infographic?
Yes, PowerPoint offers templates that can be customized for infographics, saving time on layout and design.
What type of data works best in an infographic?
Infographics are ideal for simplifying complex data, comparisons, processes, or key statistics that need visual emphasis.
How do I save my infographic as an image?
You can save your slide as an image by going to "File" > "Save As" and selecting formats like JPEG or PNG.


