How to make a chart in google slides


Enhance your Google Slides with dynamic visuals. Learn to create impactful charts in a breeze.
In the dynamic landscape of presentations, incorporating visual elements like charts enhances the storytelling aspect. Google Slides provides a user-friendly avenue for seamlessly integrating charts into your slides. Let's delve into the step-by-step process, ensuring you can effortlessly wield the power of data visualization.
How to make a chart in google slides
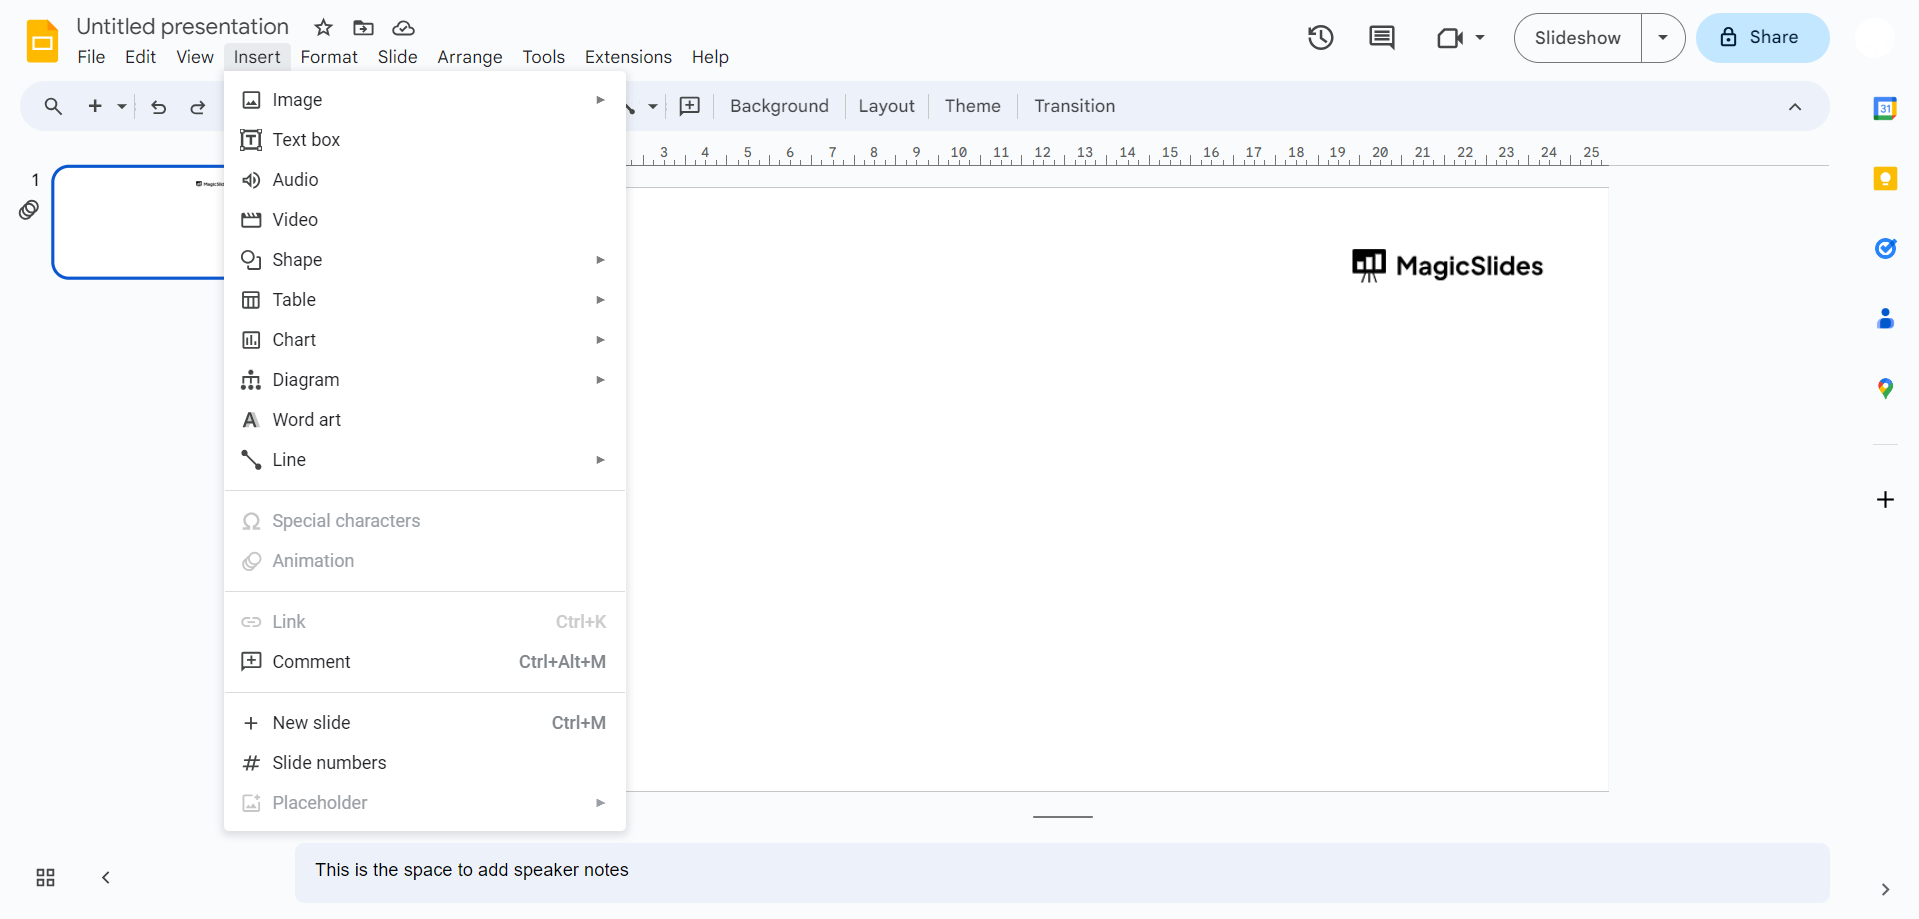
Step 1: Navigate to the 'Insert' Menu
Begin your journey by accessing the 'Insert' menu located on the menu bar at the top of your Google Slides interface. A pivotal starting point, this menu is your gateway to a plethora of elements that can elevate your presentation.
Step 2: Click on 'Chart'
Once within the 'Insert' menu, scroll down to locate and click on the 'Chart' option. This action initiates the process of integrating a dynamic chart into your Google Slides presentation.
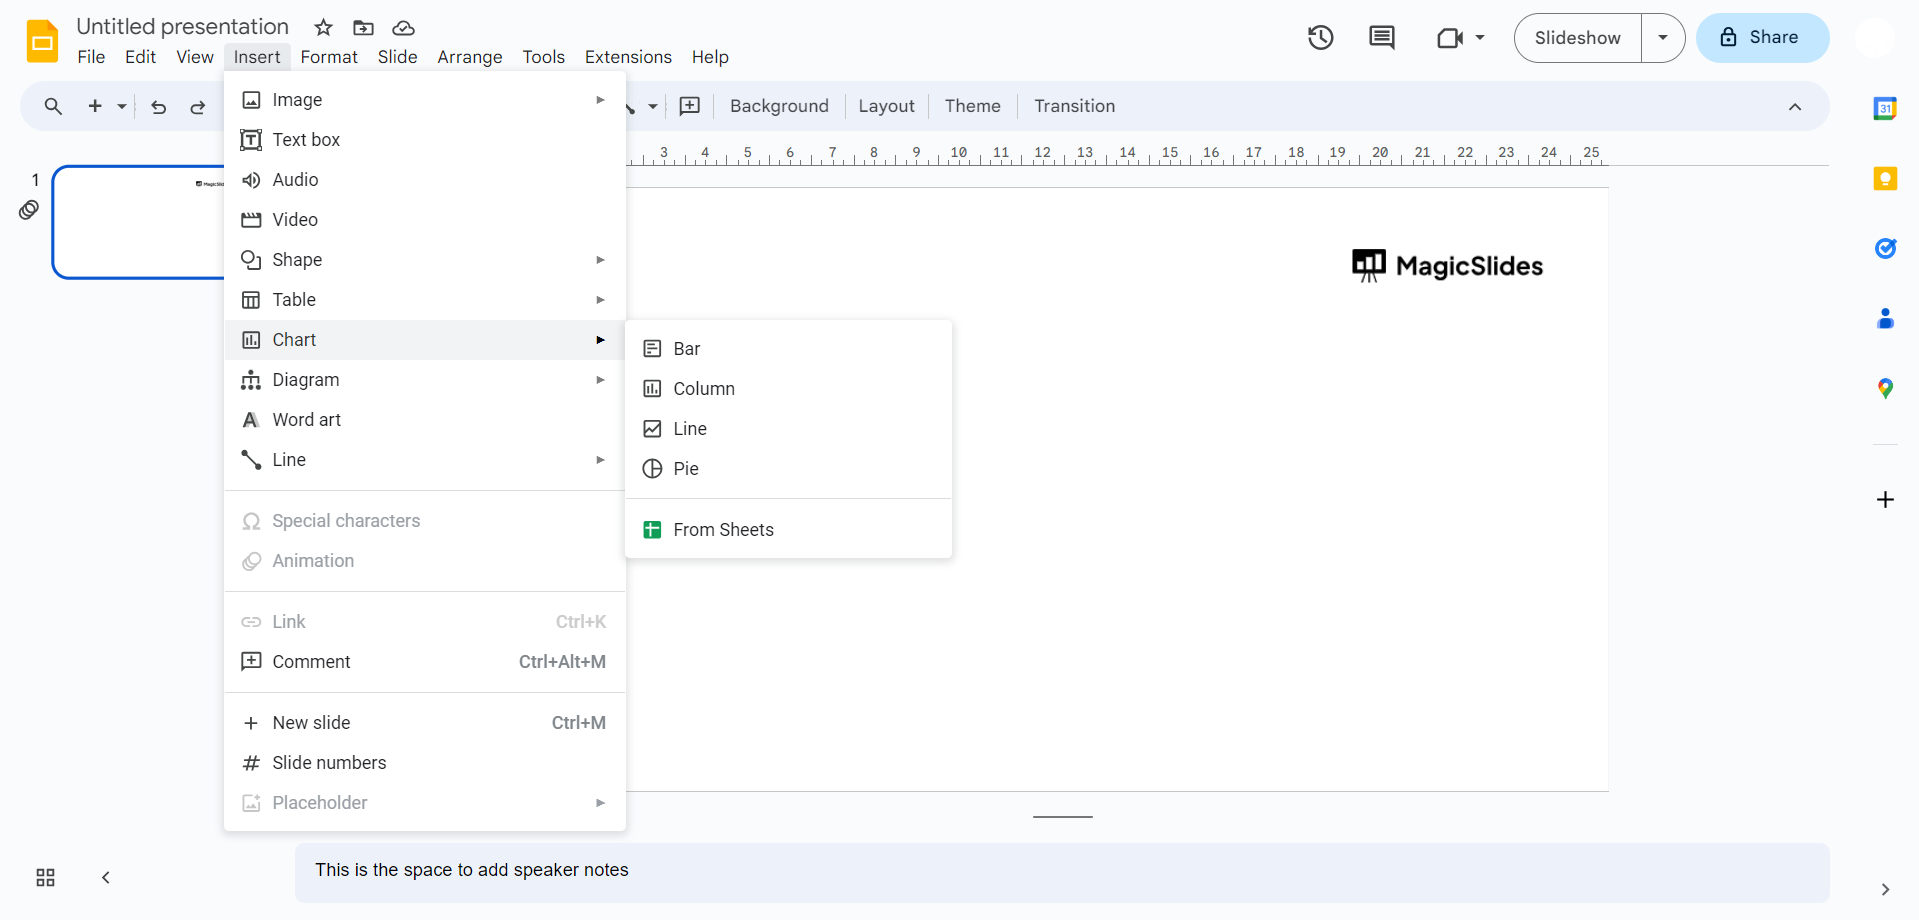
Step 3: Select Chart Type – 'Bar'
Within the 'Chart' submenu, opt for the 'Bar' chart type. This choice enables the creation of a bar chart, a versatile visual representation of data that effectively communicates comparisons.
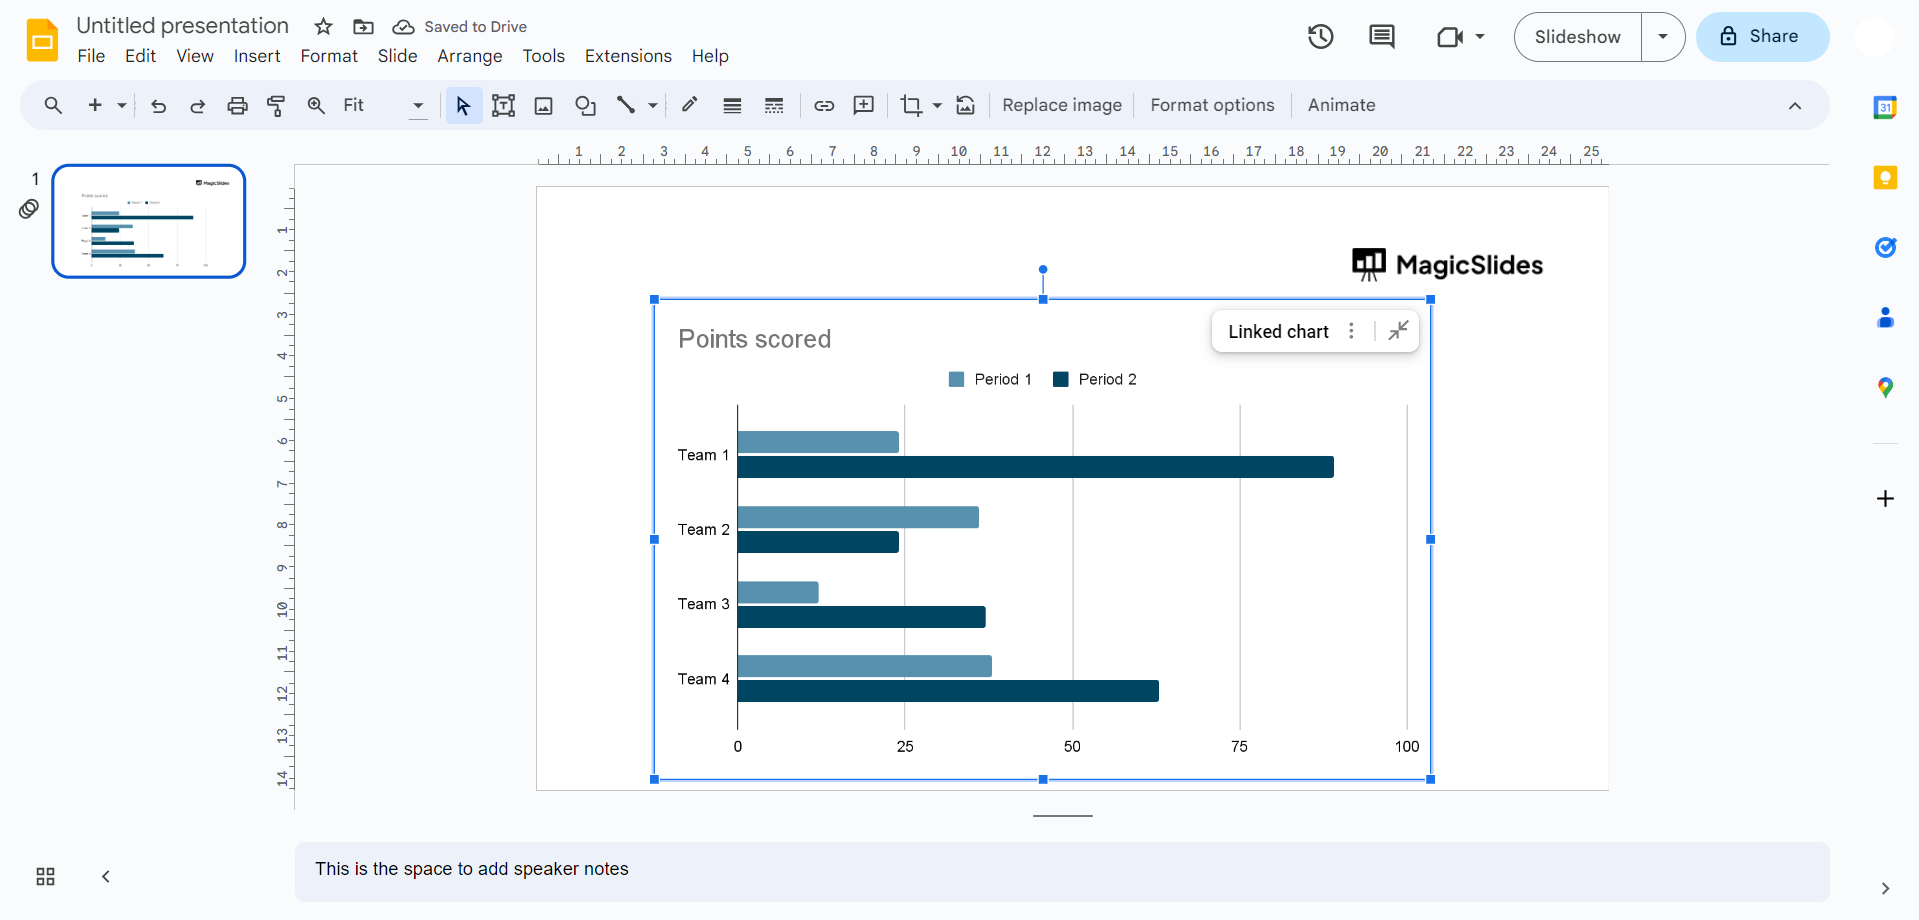
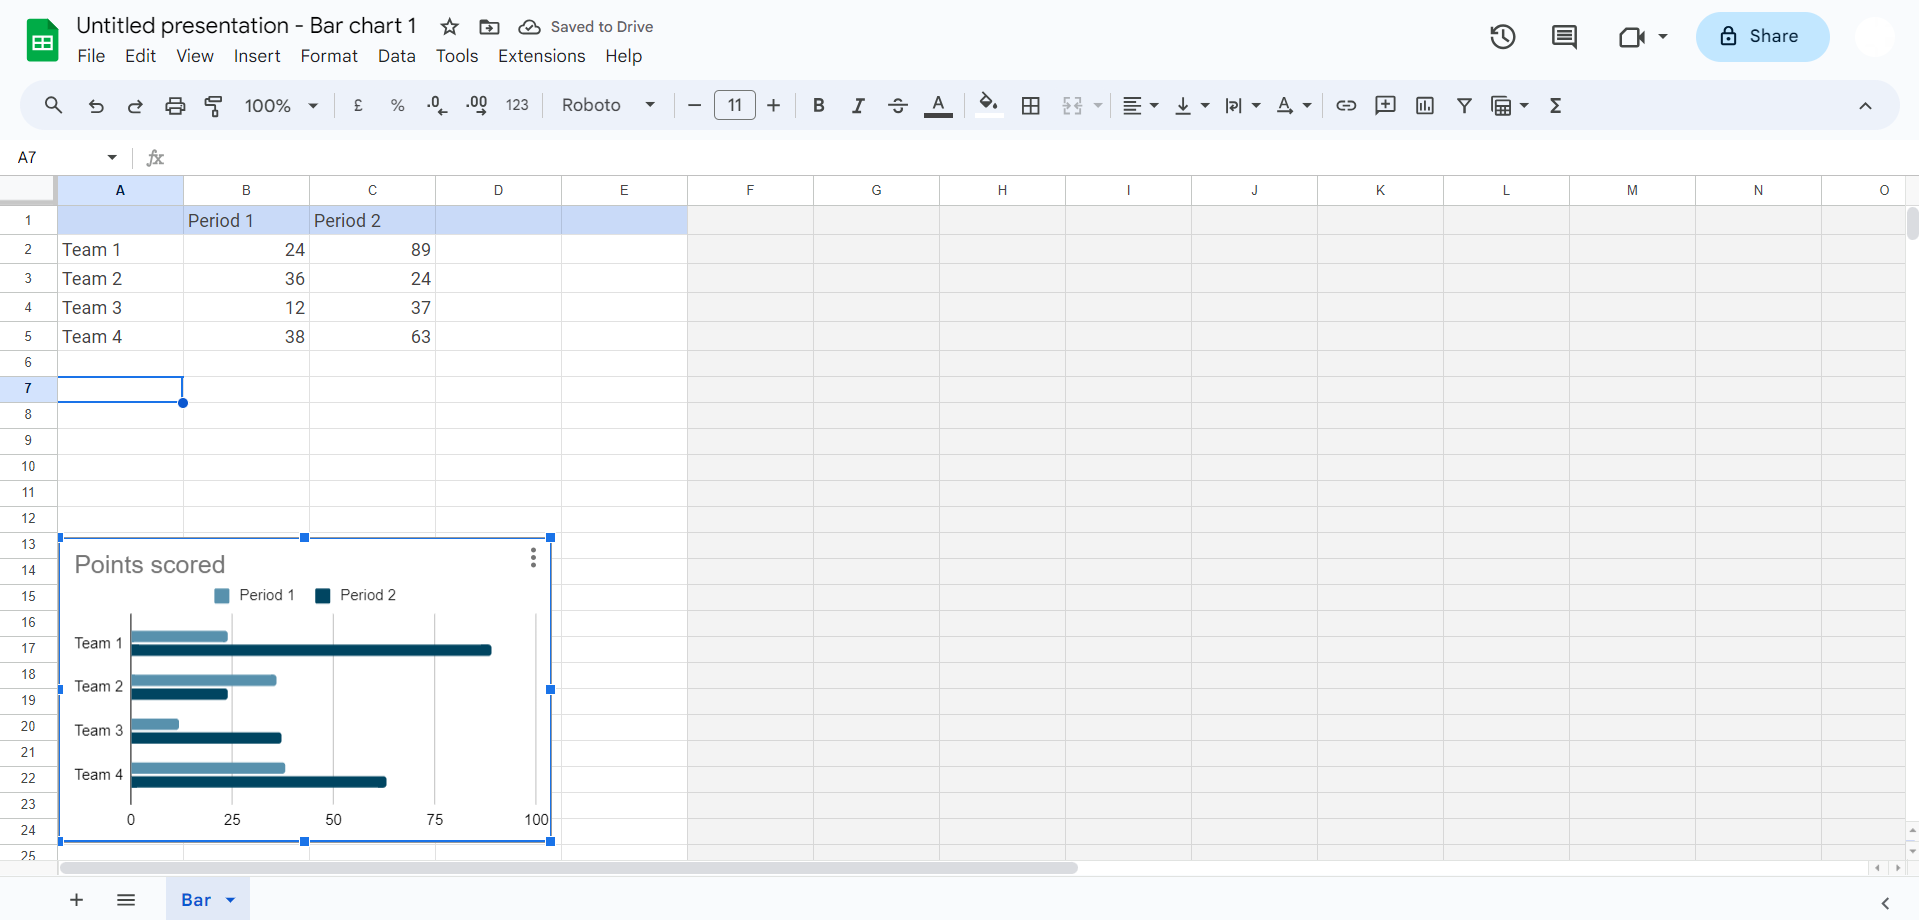
Step 4: Customize Your Bar Chart
As you click 'Bar'/ any chart that you want to create, witness the seamless insertion of a bar chart into your Google Slides file. The next crucial step involves tailoring the chart to your specific data. Click on the chart to access the source data, allowing you to input your unique dataset and craft a chart that precisely conveys your message.
Conclusion:
With these simple yet impactful steps, you've successfully added a visually compelling chart to your Google Slides presentation. Whether you're narrating financial trends, project timelines, or survey results, harness the potential of charts to engage and inform your audience. Elevate your presentations with the art of data visualization in Google Slides!
Frequently Asked Questions:
Q1: Can I edit the chart type after inserting it into Google Slides?
A: Absolutely! Click on the inserted chart, go to the Chart Editor on the right, and explore different chart types.
Q2: Is it possible to import data from external sources into the Google Slides chart?
A: Yes, the Google Sheets integration allows seamless importing of data into your Google Slides chart. Click on the chart, then on the 'Open Source' button.
Q3: Can I customize the appearance of my bar chart to suit my presentation theme?
A: Certainly! Click on the chart, navigate to the Chart Editor, and explore options to customize colors, fonts, and other visual elements.
Q4: How do I resize or reposition the inserted chart within my Google Slides slide?
A: Click on the chart to select it. You'll see corner and side handles; click and drag these to resize the chart. To reposition, click and drag the entire chart to your desired location.
Have a look @these info blogs:
- How To Mirror Images In Powerpoint: https://www.magicslides.app/blog/How-to-mirror-images-in-powerpoint
- How To Add Gif In Google Slides: https://www.magicslides.app/blog/How-to-add-gif-in-google-slides
- How To Turn A Powerpoint Into Google Slides: https://www.magicslides.app/blog/How-to-turn-a-powerpoint-into-google-slides
- How To Group Objects In Powerpoint: https://www.magicslides.app/blog/How-to-group-objects-in-powerpoint


