Addon google slides iconPPT with AISlide TemplatesPPT TemplatesPricingBlog
PPT with AISlide TemplatesPPT TemplatesPricingBlog
  1. Home
  2. Blog
  3. How to make a graph on google slides

How to make a graph on google slides

magicslides app

Published By

magicslides app
Mohit Kumar Jha

Approved By

Mohit Kumar Jha

Published On

July 23th, 2024

Reading Time

2 min read

Transform data into visual stories with our guide on effortlessly creating impactful graphs in Google Slides.

Data visualization is a powerful tool in any presentation, transforming raw information into meaningful insights. Google Slides, with its user-friendly interface, offers a seamless way to integrate graphs into your slideshows. In this comprehensive guide, we'll walk through the steps of creating a graph in Google Slides, empowering you to convey complex data in an accessible and visually appealing manner.

Steps to Make a Graph in Google Slides:

Open Google Slides:

Access your Google Drive and open the Google Slides presentation where you want to insert a graph.
notion image

Insert a New Slide:

Click on the "+" icon in the upper-left corner to add a new slide to your presentation.
notion image

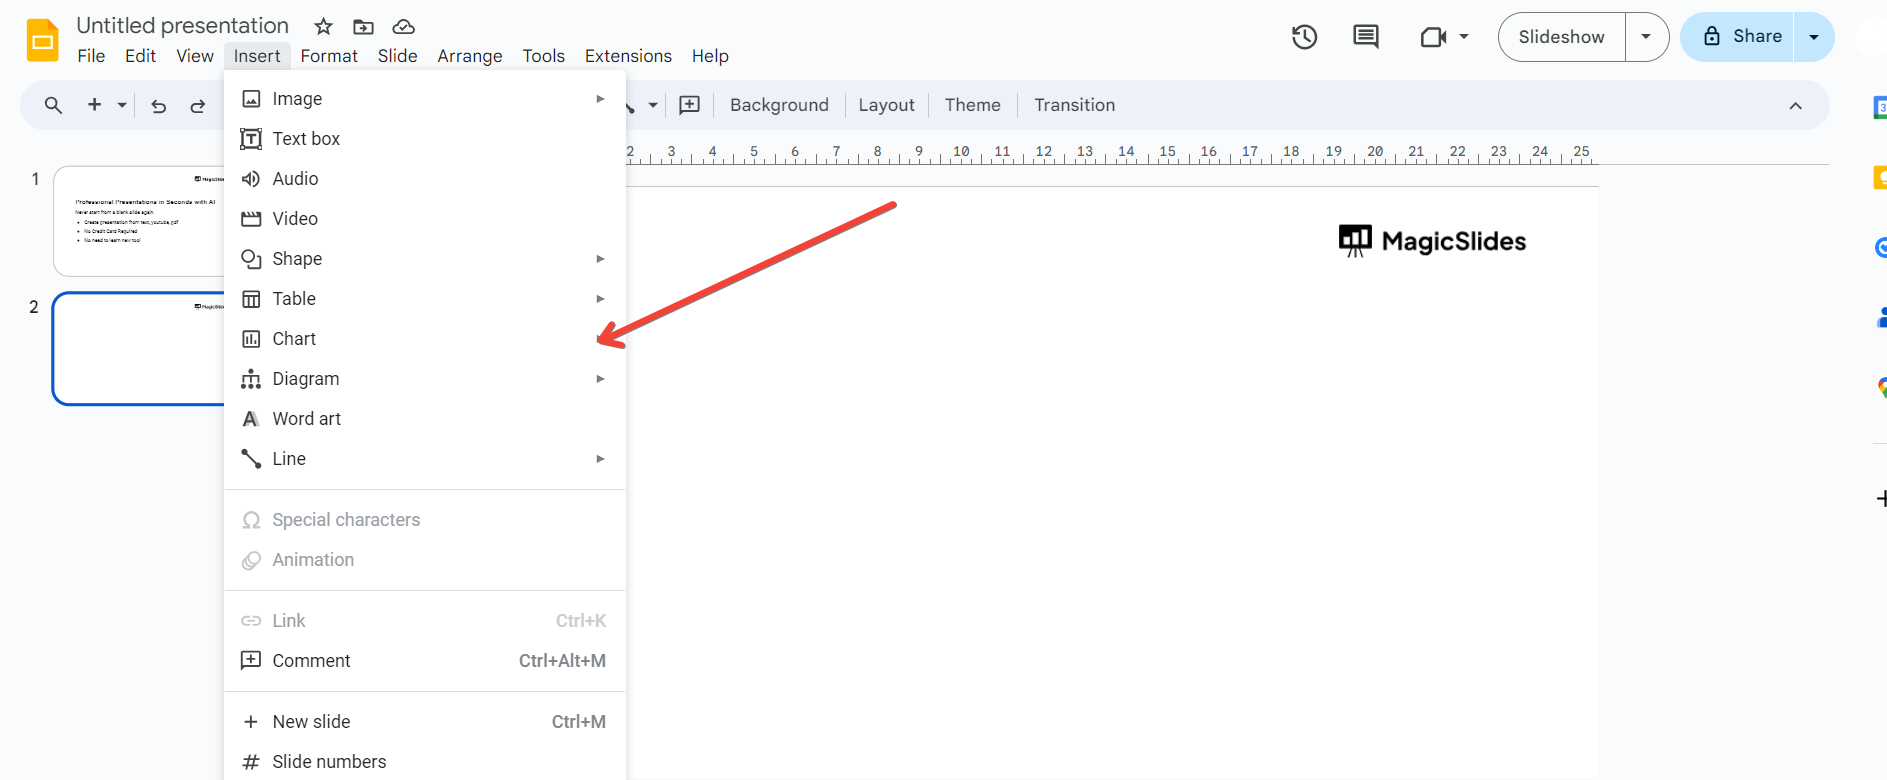
Access the Chart Tool:

In the toolbar, click on the "Insert" tab and select "Chart" from the drop-down menu.
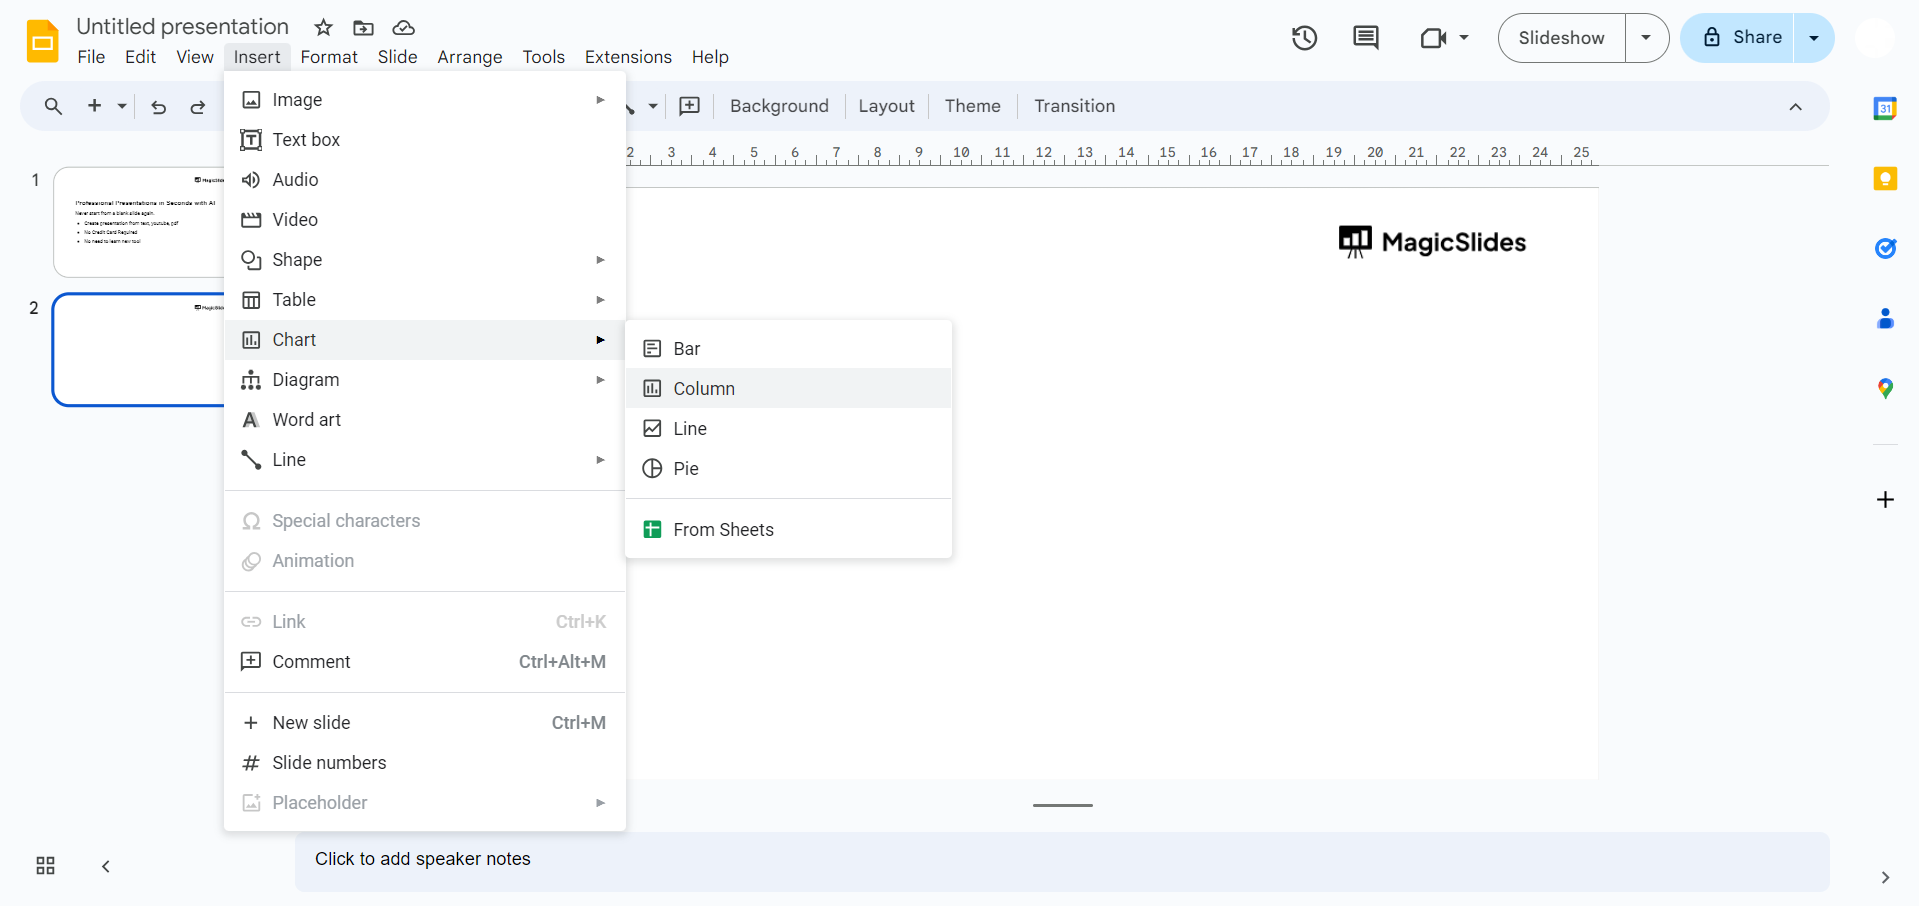
notion image

Choose Chart Type:

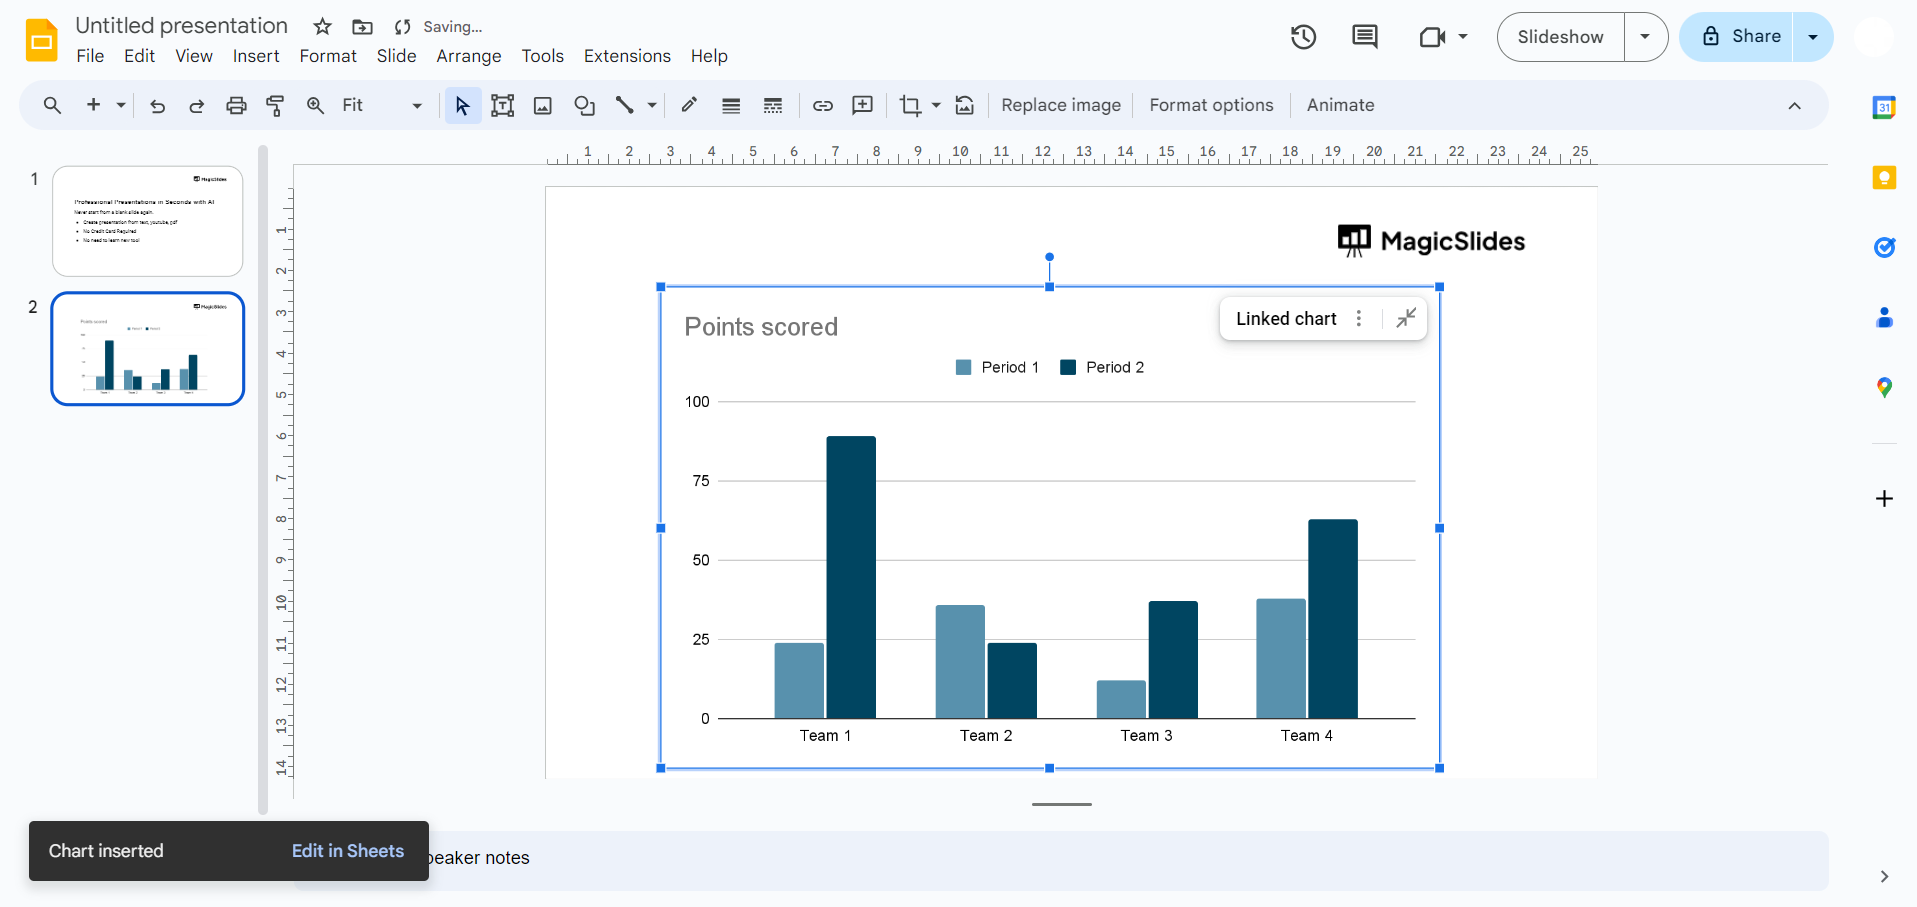
The "Chart Editor" panel will appear on the right. Select the type of chart you want (e.g., bar, line, pie).
notion image

Input Data:

A spreadsheet will open where you can input your data. Replace the placeholder data with your own.

Customize Chart:

Customize your chart by adjusting titles, labels, colors, and other formatting options in the Chart Editor.
notion image

Resize and Position:

Click and drag to resize the chart. Use the corner handles to maintain proportions. Position it as desired on the slide.
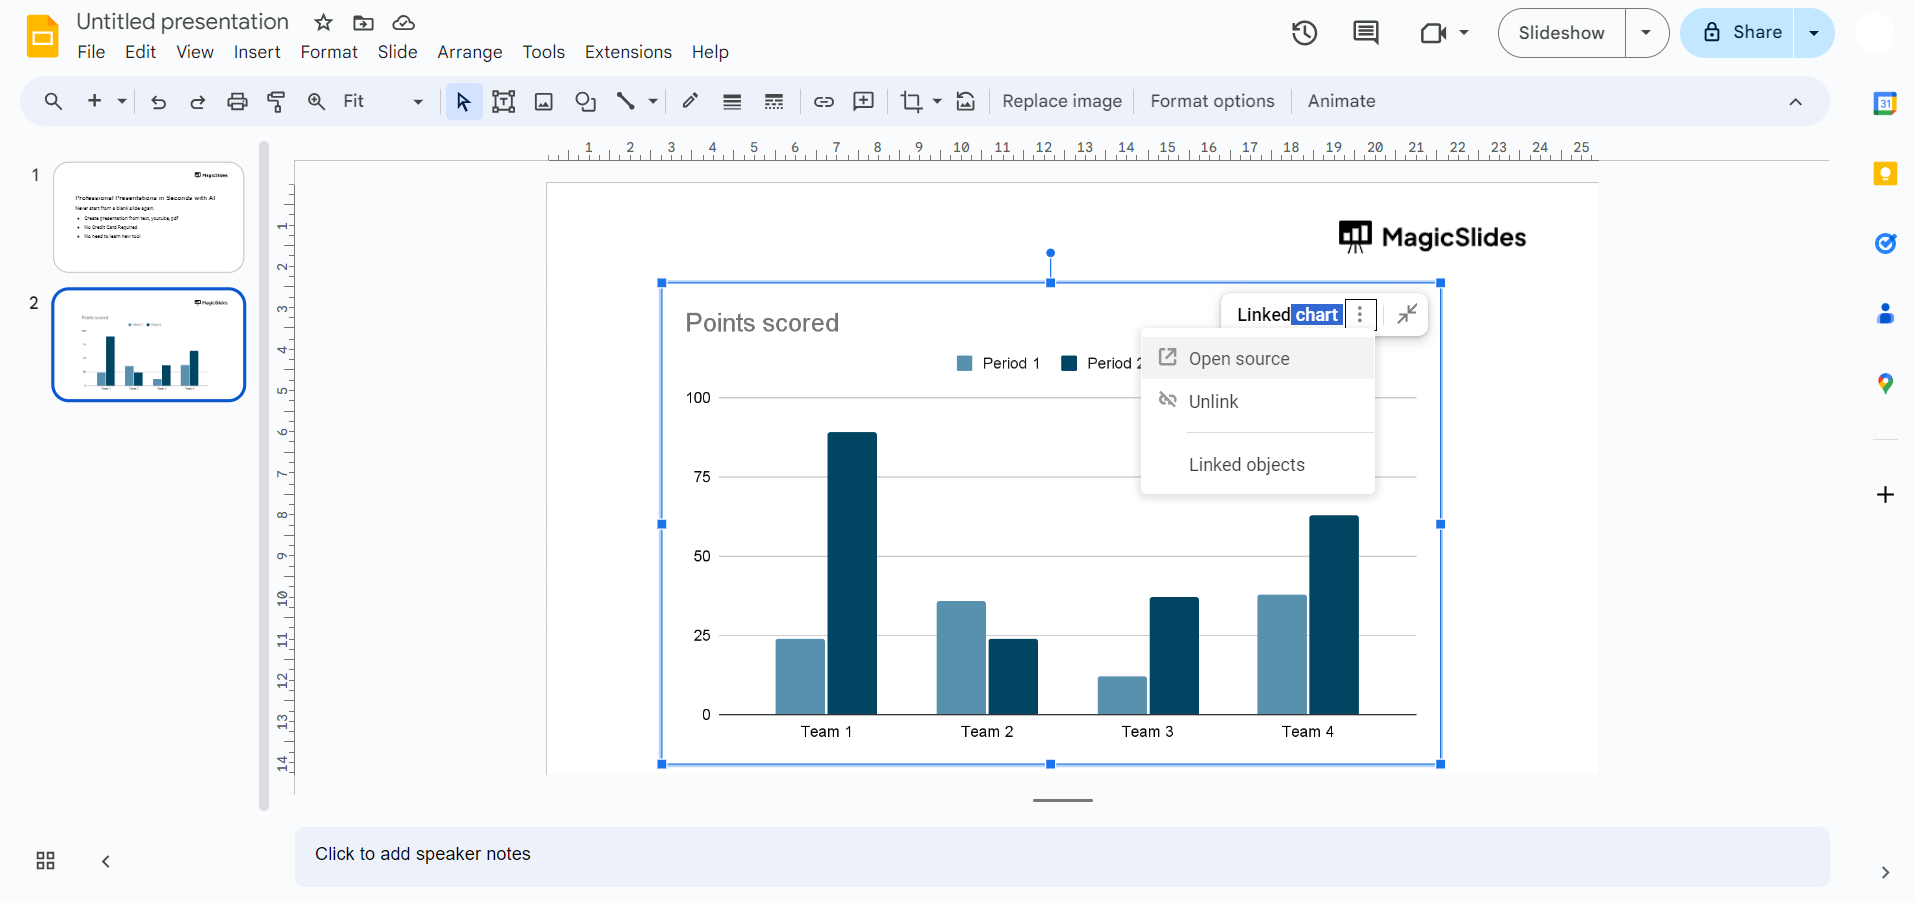
Edit Data:

To make changes, double-click the chart. The Chart Editor will reopen, allowing you to edit data or adjust settings.
notion image

Conclusion:

Integrating graphs into your Google Slides presentation can transform dry statistics into compelling visual narratives. With these simple steps, you can effortlessly create and customize graphs, enhancing your ability to communicate complex information effectively. Elevate your presentations, engage your audience, and bring your data to life with the dynamic visual storytelling capabilities of Google Slides.

Frequently Asked Questions:

Can I update the data in the graph without recreating it when my information changes?
Yes, simply double-click on the chart, and the Chart Editor will allow you to update data.
Are there options to change the style and appearance of the graph for better customization?
Absolutely, the Chart Editor in Google Slides provides various customization options, allowing you to personalize the graph's appearance.
Can I collaborate on creating a graph with others in real-time using Google Slides?
Yes, Google Slides supports real-time collaboration, enabling multiple users to work on a presentation simultaneously.
Is it possible to animate the graph for a more dynamic presentation?
Certainly, Google Slides allows you to add animations to your graphs, enhancing the visual appeal during presentations.
 

Share on socials

About the author

Sanskar Tiwari profile photo
Sanskar Tiwari— Founder @ MagicSlides — Product & AI

Sanskar Tiwari is the founder of MagicSlides and IAG Tech. Over the past 5 years, he has shipped 24+ products and taught 100k+ students how to code. His work focuses on AI‑assisted creation and developer education.

More from Sanskar

More from the blog

    How to add morph Transition in PowerPoint

    15 March 2026

    How to Convert PPT to Google Slides - Complete 2026 Guide

    13 March 2026

    How to animate google slides

    10 March 2026

    50+ Funny Presentation Topic Ideas to Get You Started

    5 March 2026

    Scribd PPT Downloader Free: Step-by-Step Guide (Updated 2026)

    2 March 2026

    100+ Technology Topics for Presentations (Updated List)

    2 March 2026

    50+ Biology Presentation Topics: Inspiring Ideas for All Audiences

    2 March 2026

    How to Get More New Google Slides Themes

    27 February 2026

    How to insert bitmoji into Google Slides

    26 February 2026

Table of Contents

Create Presentations in Seconds

Transform your ideas into professional presentations with AI. No design skills needed.

Try MagicSlides Free

Create Stunning Presentations with AI in Seconds ✨

Transform any topic, text, YouTube video, PDF or URL into beautiful presentations instantly with MagicSlides AI.

Try MagicSlides AI Presentation Maker
MagicSlides AI Presentation

Footer

Solutions

  • MagicSlides App
  • Google Slides Add-on
  • MagicSlides in Chrome
  • MagicSlides in Figma
  • MagicSlides in ChatGPT
  • MagicSlides in Telegram
  • MagicSlides in Zapier
  • MagicSlides in Figma Slides

Tools

  • AI PPT Tools
  • QR Code Generator
  • Design Tools
  • PPT Templates
  • Slide Templates
  • PDF Tools

Examples

  • AI Presentations
  • PPT by MagicSlides
  • Quizzes
  • Charts
  • Coloring Pages

Resources

  • Changelog
  • Documentation
  • API Docs

Top Blogs

  • How to Create Presentation Using ChatGPT
  • 100+ Best Seminar Topics for Students in 2025

Company

  • Help
  • MCP
  • Blog
  • Pricing
  • Affiliate Program
  • Manage Subscription
  • Privacy Policy
  • Contact Us
  • Terms & Conditions
  • Refund & Cancellation Policy

We also built

  • SheetAI - GPT For Sheets
  • MagicForm - GPT For Google Forms
  • SecondBrain.fyi
  • BlogBee - Free Blogging Platform

© 2026 IndianAppGuy Tech Pvt Ltd. All rights reserved.